
Link copied!
Volume Oscillator
The volume oscillator helps in understanding the strength of trend continuation and reversals by calculating the difference between two moving averages of a security’s volume, which is expressed as a percentage.
Key Takeaways
- The volume oscillator compares short-term and long-term volume averages to measure the strength behind a price trend. A rising oscillator shows strong momentum; a falling oscillator warns of weakening strength.
- There are different types of volume oscillators based on how volume is used:
- PVO (Percentage Volume Oscillator) shows recent volume changes in percentage terms.
- KVO (Klinger Volume Oscillator) tracks smart money flow by combining price and volume.
- OBV (On-Balance Volume) adds or subtracts daily volume to confirm trend strength.
- CMF (Chaikin Money Flow) measures buying or selling pressure using volume and price together.
- Volume oscillators are flexible and can be used across stocks, commodities, forex, and crypto, on any timeframe, like daily, weekly, or hourly charts.
- They work best when used with other indicators like moving averages or RSI for confirmation, because using them alone can sometimes give false signals.
What Is Volume Oscillator?
The volume oscillator is a tool that helps you figure out if a trend in the market is likely to continue or if it might reverse. It does this by comparing two different averages of trading volume, one short-term and one long-term.
It looks at how much trading activity is happening now versus how much has been happening over a longer period. The difference between these two averages is shown as a percentage. If the percentage is high, it could mean strong momentum; if it’s low or negative, it might suggest that the trend is losing strength and could change direction.
How to Calculate Volume Oscillator?
To calculate the volume oscillator volume of moving averages, for certain types of days, here is how it is calculated:
Formula to calculate Volume Oscillator
VO = [(Short-Term Volume MA – Long-Term Volume MA) / Long-Term Volume MA] × 100.
Short-Term Volume MA
Average of trading volume over a short recent period (like 5–10 days).
Long-Term Volume MA
Average of trading volume over a longer period (like 20–30 days).
Short-Term MA – Long-Term MA
Measures if recent volume is higher or lower compared to the longer trend.
Divide by Long-Term MA
Standardises the difference by comparing it to the usual (long-term) volume.
Key Features of Volume Oscillators
Since the Volume Oscillator measures the momentum behind price moves, its key features revolve around spotting early trend shifts and confirming strength.
You can control how fast or slow the oscillator reacts.
The Volume Oscillator’s sensitivity depends on the time periods you choose for the short-term and long-term moving averages. If you pick very short periods, the oscillator will react quickly to volume changes. If you pick longer periods, it will move more slowly but give more stable signals.
Works for any stock, commodity, or timeframe.
The Volume Oscillator isn’t restricted to just one market or one time setting. You can use it for stocks, forex, commodities, or crypto, and on daily, weekly, or even hourly charts. This makes it flexible for different trading styles like intraday, swing, or long-term.
Best used with price and momentum indicators.
The Volume Oscillator gives better results when combined with other tools. For example, you can pair it with price trend indicators (like Moving Averages) or momentum indicators (like RSI) for stronger confirmation. Using it alone might give false signals, but together, it strengthens your analysis.
Types of Volume Oscillators
Depending on how you calculate or fine-tune volume behaviour, different types of Volume Oscillators are used for different trading needs.
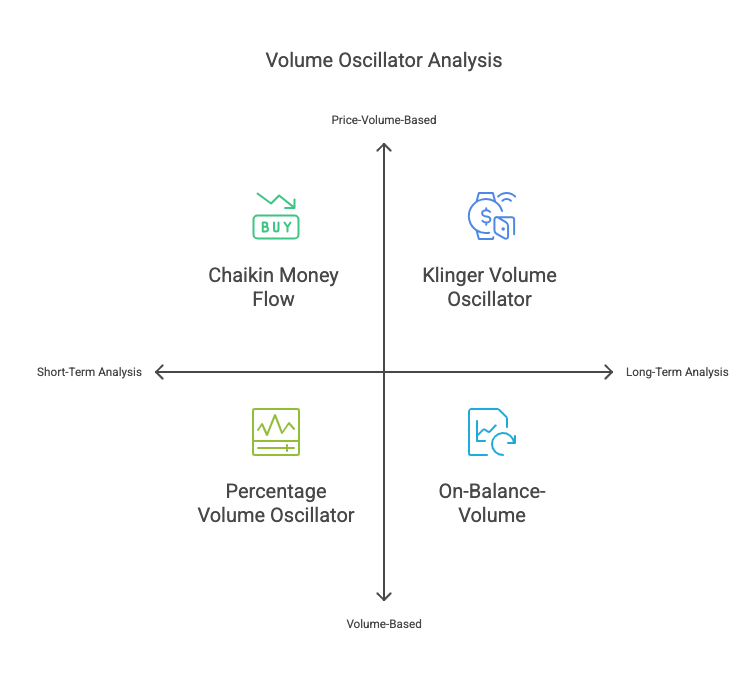
1. Percentage Volume Oscillator (PVO)
The PVO shows how much recent volume has been rising or falling compared to a longer period, but it is expressed in percentage terms. It helps traders spot when volume is strongly supporting a price move or fading away. Traders often use it to confirm breakouts or warn of weak trends even when the price looks strong.
2. Klinger Volume Oscillator (KVO)
The KVO calculates long-term money flow by factoring both price direction and volume together.
It tries to detect whether big investors (“smart money”) are quietly buying or selling. Traders use it to catch early trend reversals or confirm the strength behind large price swings.
3. On-Balance-Volume (OBV)
The OBV line goes up when volume is heavy on up days and falls when volume is heavy on down days. It helps traders see whether volume supports the price move or warns them of a hidden reversal.OBV is often used to confirm breakouts or detect divergence between price and volume.
4. Chaikin Money Flow (CMF)
CMF looks at whether buying pressure (accumulation) or selling pressure (distribution) is dominating, based on price positioning and volume. It gives traders an idea of whether demand is strong enough to sustain a trend. A positive CMF signals bullish sentiment; a negative CMF signals bearish sentiment.
Limitations Of Volume Oscillator
Here are some downsides of volume oscillators:
False Signals
Volume oscillators can give wrong signals in low-volume or highly volatile markets.
Lagging Nature
Since they use moving averages, VOs often react after the actual price move has already started.
Need for Confirmation
Always pair VOs with other indicators like RSI or MACD for more reliable trading decisions.
How to use volume oscillators?
Volume oscillators help traders analyse whether price movements are supported by strong trading activity. By comparing short-term and long-term volume averages, they indicate whether momentum is increasing or fading.
Start by adding the Volume Oscillator to your chart and selecting appropriate time periods based on your trading style. Shorter periods react quickly to changes, while longer periods provide smoother signals.
A rising oscillator suggests increasing volume and stronger trend momentum, while a falling oscillator indicates weakening participation and a possible slowdown or reversal. Sudden spikes in the oscillator can signal potential breakouts backed by strong market interest.
For better accuracy, volume oscillators should be used alongside price action or indicators like moving averages or RSI, as relying on them alone may lead to false signals.
Conclusion
The Volume Oscillator is a helpful tool for understanding the strength of price movements by comparing recent and past trading volumes. It can signal when a trend is likely to continue or when it might reverse.
However, since it uses moving averages, it can sometimes lag and give false signals, especially in volatile markets. To use it effectively, traders should combine it with other indicators for confirmation. Whether you are a beginner or experienced trader, understanding volume behaviour through oscillators can greatly improve the timing and strength of your trading decisions.
Frequently Asked Questions (FAQs)
What is the best volume oscillator?
There’s no single “best” volume oscillator; it depends on your trading style.PVO is great for spotting sudden volume bursts, KVO is better for tracking smart money flows, and OBV is useful for confirming trends early. Smart traders often use 1–2 together based on the situation.
What is the difference between Volume Oscillator and OBV?
The Volume Oscillator (VO) shows the percentage difference between short-term and long-term volume averages. On-Balance Volume (OBV) simply adds or subtracts daily volume based on whether the price closed higher or lower.VO focuses on volume momentum, while OBV tracks cumulative volume pressure over time.
What is a Volume Zone Oscillator (VZO)?
The Volume Zone Oscillator measures buying and selling pressure using volume levels and price zones. It moves between +100 and -100 and shows whether the market is in a strong buying zone, a selling zone, or neutral. Traders use VZO to time entries and exits based on volume-driven strength.
How to check the volume oscillator?
Volume oscillators compare short-term and long-term volume to show trend strength. Rising values indicate strong momentum, while falling values suggest weakness. Traders use them with price action or indicators like RSI to confirm trends and avoid false signals.
What is a Volume Map?
A Volume Map is a visual chart that shows where the highest trading activity happened at different price levels. It helps traders spot key support and resistance areas based on where most buying and selling occurred. Think of it as a heat map of important price zones.
Disclaimer: This content is for educational purposes only and does not constitute financial or investment advice. Investments in securities or other financial instruments are subject to market risk, including partial or total loss of capital. Past performance is not indicative of future results. Always consider your financial situation carefully and consult a licensed financial advisor before making investment or trading decisions.
Engineered for the obsessed. Built for traders.

Purpose-built terminals.
Zero compromise.
Built for speed.
Plot No 1290, 2nd Floor, 17th Cross, 5th Main, Sector-7, HSR Layout, Bangalore 560102
Follow us on
Mintcap Brokers Private Limited
CIN – U66110KA2023PTC178706 | Registered Address: Plot No 1290, Second Floor, 17th Cross, 5th Main, Sector-7, HSR Layout, Bangalore 560102 | Tel: 080 – 49552310 | Email ID: compliance@capmint.com | SEBI registered Stock Broker: INZ000322732 | NSE Cash/F&O Member ID: 90430 | BSE Cash/F&O Member ID: 6903 | MCX Member ID: 57400 | NCDEX Member ID: 1312 | SEBI registered Depository Participant: IN-DP-806-2025 | CDSL DP ID: 12102300 | NSE Clearing Member code: M70108 | AMFI-Registered Mutual Fund Distributor: ARN-289109 (Valid upto 28-Feb-2027) | Category II Execution Only Platform : E6903
Details of Client Bank Account
Compliance Officer: Ms. Shridevi Vungarala | Email ID: compliance@capmint.com | Tel no. + 91 9035330126 | Grievance Redressal Officer (GRO) – Ms. Shikha Gupta | Email ID: Grievance@capmint.com | Tel no: 9035331595.
Procedure to file a complaint on SEBI SCORES: Register on SCORES portal. Mandatory details for filing complaints on SCORES: Name, PAN, Address, Mobile Number, E-mail ID. Benefits: Effective Communication, Speedy redressal of the grievances. You may refer the website https://scores.sebi.gov.in/ for more information. You may also download the SEBI Scores app to log a complaint Android: https://play.google.com > store > apps > sebiscores iOS: https://apps.apple.com > app > sebiscores
Disclaimer
Investment in the securities market are subject to market risks, read all the related documents carefully before investing. Brokerage will not exceed the SEBI prescribed limit.
Mutual fund investments are subject to market risks, read all scheme related documents carefully before investing. Mutual Funds are not exchange-traded products.
Attention Investor:
- Stock Brokers can accept securities as margin from clients only by way of pledge in the depository system w.e.f. September 1, 2020.
- Update your mobile number & email Id with your stock broker/depository participant and receive OTP directly from depository on your email id and/or mobile number to create pledge.
- Pay 20% as upfront margin of the transaction value to trade in cash market segment.
- Investors may please refer to the Exchange’s Frequently Asked Questions (FAQs) issued vide circular reference NSE/INSP/45191 dated July 31, 2020 and NSE/INSP/45534 dated August 31, 2020 and other guidelines issued from time to time in this regard.
- Check your Securities /MF/ Bonds in the consolidated account statement issued by NSDL/CDSL every month.