
Link copied!
Support Levels
In technical analysis, a support level is a price point where a stock tends to stop falling and may bounce back up. It’s like a floor where buying interest is strong enough to prevent the price from dropping further.
Key Takeaways
- Support acts as a price floor: It’s a level where buying interest is strong enough to prevent further price decline, often leading to a bounce.
- Different types of support exist: These include horizontal support, trendline support, and dynamic support from moving averages.
- Support aids in trade decisions: Traders use support levels for entries, placing stop-losses, and confirming trend strength.
- Support isn’t foolproof: False breakouts, market noise, and overreliance without other tools can lead to bad trades; always confirm with volume or indicators.
Introduction
In technical analysis, identifying potential entry and exit points is critical for successful trading. One of the most widely used tools in this regard is the concept of support levels. These levels are crucial for traders who want to make informed decisions based on price action.
Understanding support levels not only helps identify potential buy zones but also aids in managing risk more effectively. This article dives deep into support levels, how they work, and how traders can leverage them in their trading strategies.
What are Support Levels?
Support levels represent a price point on a chart where a stock or asset tends to find buying interest as it declines. In simple terms, it’s like a floor that prevents the price from falling further. At this level, demand is typically strong enough to overcome the selling pressure, causing the price to bounce back up. These levels often emerge due to market psychology, where traders perceive the price as a good buying opportunity based on historical performance.
How Support Levels Work?
Support levels work based on the principles of supply and demand. When an asset’s price approaches a support level, buyers begin to step in, believing the price is undervalued. As demand increases, it offsets the supply, halting the decline. If the price does fall below support, it may signal a change in market sentiment, possibly indicating the beginning of a downtrend. Conversely, a successful test of support followed by a price rebound can validate the level and encourage more buying.
Identifying Support Levels
Accurately identifying support levels is a key skill in technical analysis. Traders often combine multiple methods to pinpoint strong and reliable support zones. Here’s how you can effectively identify them:
Price Charts
Examine historical price data to find levels where the stock has previously bounced back multiple times. These recurring reversal points often mark strong horizontal support zones.
Volume Analysis
Pay close attention to volume spikes near potential support. Higher volume at support levels suggests increased buying interest, which reinforces the level’s strength.
Technical Indicators:
Indicators like the Relative Strength Index (RSI) or Moving Average Convergence Divergence (MACD), when oversold or showing bullish divergence near a support zone, can provide additional confirmation for a price reversal.
Multiple Timeframes
Analysing support across different timeframes (e.g., daily, weekly) helps validate key zones. A level that appears significant on both the daily and weekly charts carries more weight and reliability.
Candlestick Patterns
Look for reversal patterns like hammer, doji, or bullish engulfing candles forming near support levels. These patterns often indicate a possible bounce and add conviction to the setup.
Pro Tip: Always mark potential support zones with zones rather than exact price points, as price action may slightly pierce or approach support before reversing. We can see the same in the figures attached in the examples above.
Types of Support Levels
Understanding the various types of support levels can enhance your analysis:
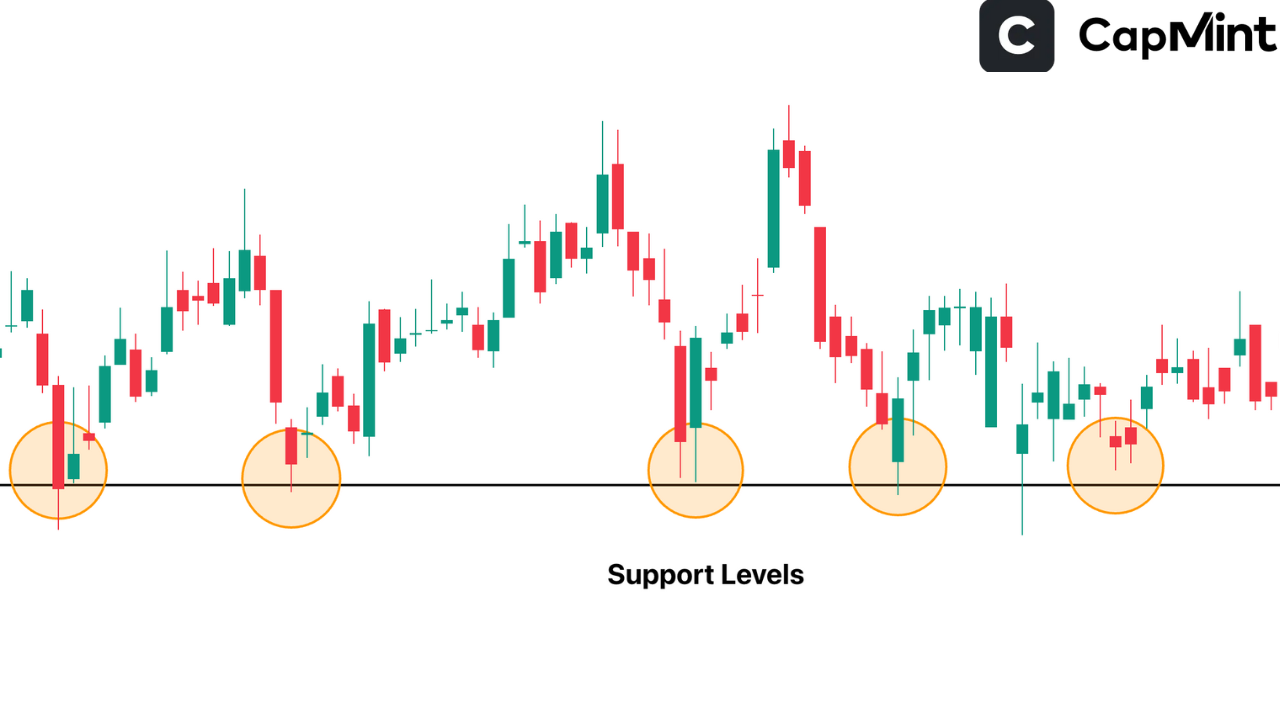
Horizontal Support
This is the most basic form of support, appearing as a horizontal line on the chart where price has repeatedly bounced in the past.
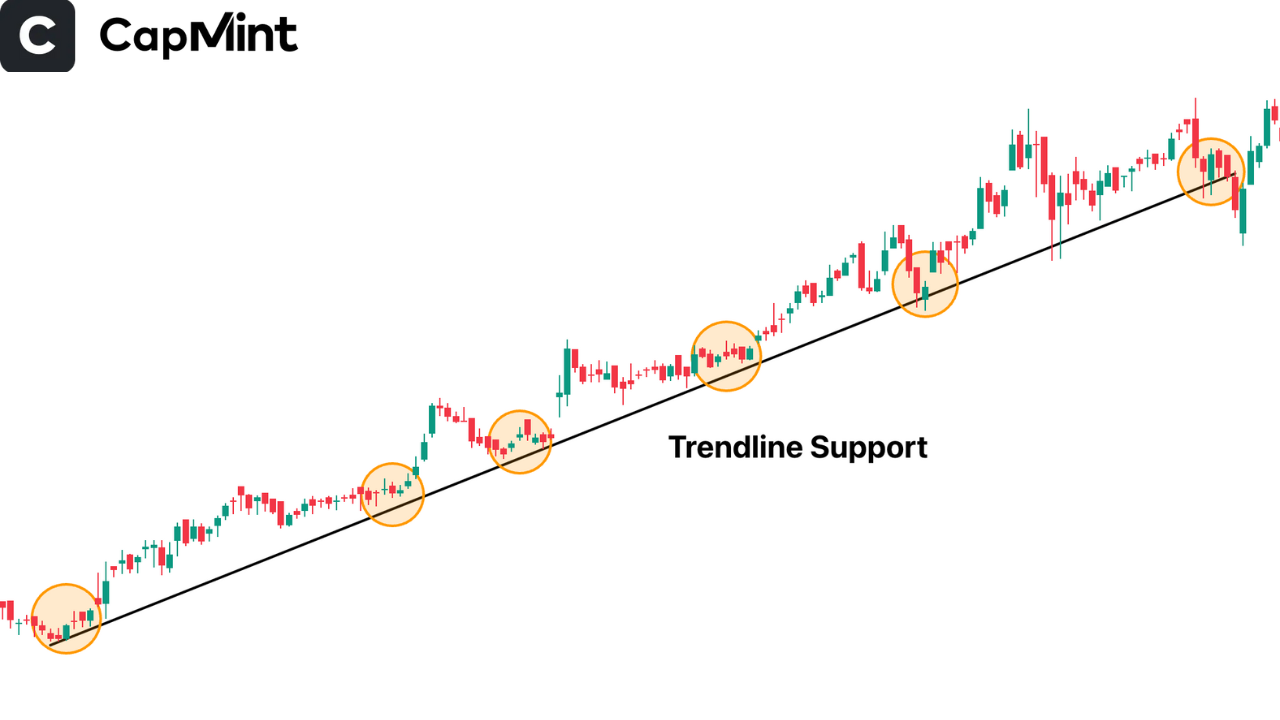
Trendline Support
These are diagonal lines drawn along a trend to show support in an uptrend. Each time the price touches the trendline and bounces, the support is confirmed.
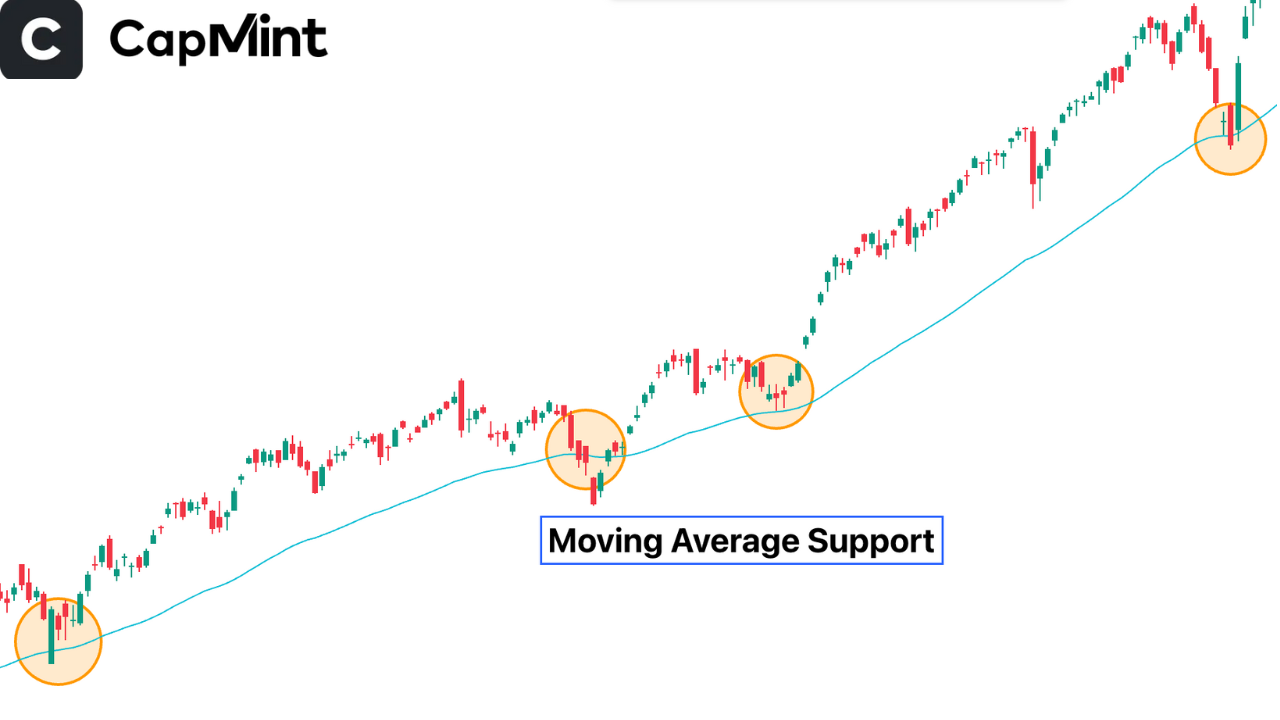
Moving Average Support
Moving averages, like the 50-day or 200-day, often act as dynamic support levels. Traders watch how the price reacts when it approaches these averages.
Support and Resistance: Two Sides of the Same Coin
Support and resistance are interconnected concepts. While support is the level where buying emerges, resistance is where selling pressure builds, capping price advances. Interestingly, once a support level is broken, it can turn into a resistance level and vice versa. This phenomenon is known as a support-resistance flip and is crucial in chart pattern recognition.
Trading With Support Levels
Support levels are more than just lines on a chart, they are critical tools that guide traders in making rational and strategic decisions. Here’s a more detailed look at why they matter:
Entry Points
Support zones often act as low-risk entry points. When a stock approaches a support level that has held in the past, traders look for confirmation to initiate long positions. The rationale is that the downside risk is limited, while the upside potential is favourable if the support holds.
Stop-Loss Placement
Proper risk management is the backbone of successful trading. Traders commonly place stop-loss orders just below the support level to protect against sharp downward moves. If the support fails, the stop-loss ensures minimal loss, preserving capital for future trades.
Trend Confirmation
A price bouncing off a support level can reinforce the prevailing trend. For instance, in an uptrend, if the price pulls back and finds support before continuing upward, it signals strength and validates the trend direction.
Limitations of Support Levels
Despite being a powerful analytical tool, support levels have their limitations, and traders should be aware of them to avoid costly mistakes:
False Breakouts
Sometimes, price dips slightly below a support level, triggering stop-losses or giving the impression of a breakdown, only to reverse sharply and move higher. These “fake outs” can mislead traders and result in premature exits or poor trade decisions. It’s essential to look for confirmation before reacting.
Market Noise
In highly volatile or news-driven markets, support levels may fail to hold due to abrupt and irrational price movements. Such random fluctuations, often termed as “market noise,” can render support zones ineffective, especially on shorter timeframes.
Overreliance
Depending solely on support levels without corroborating evidence from other technical indicators or market context can be dangerous. For instance, a strong fundamental catalyst or macro event can invalidate technical levels, no matter how historically reliable they’ve been. It’s always safer to combine support analysis with tools like RSI, MACD, trendlines, and volume analysis.
Support levels should be used as guidelines rather than guarantees. Understanding their limitations helps traders remain flexible and avoid the trap of blind faith in technical levels.
Conclusion
Support levels are foundational elements in technical analysis. They provide valuable insights into where a stock might find buying interest, making them essential for timing entries, exits, and managing trades. However, they should not be used in isolation. Combining support analysis with other tools and sound trading principles can significantly improve trading outcomes. Mastering the art of reading support levels is a step toward becoming a more disciplined and successful trader.
Frequently Asked Questions (FAQs)
How can I tell if a support level is strong?
A strong support level is one where the price has bounced off multiple times in the past, ideally with increasing volume. The more often a level is tested without breaking, the more significant it becomes. Support levels that align across multiple timeframes and show confluence with technical indicators (like RSI or moving averages) tend to be more reliable.
What happens if the price breaks a support level?
When a support level is broken decisively (especially with high volume), it often signals a potential trend reversal or acceleration downward. The broken support may then act as a new resistance, a concept known as support becoming resistance. Traders often exit long positions or consider short setups when such breaks occur.
Can support levels change over time?
Yes, support levels are dynamic. As price action evolves and new data emerges, old support levels may lose relevance, and new ones can form. Factors like changing market sentiment, earnings announcements, or macroeconomic events can shift these zones. Regular chart review helps stay updated.
Are support levels useful for all types of assets?
Support levels apply to stocks, indices, commodities, forex, and cryptocurrencies. While the concept remains the same, volatility and liquidity may affect how cleanly these levels hold across different asset classes. For example, crypto tends to have more false breakouts due to its high volatility.
Should I rely solely on support levels to make trading decisions?
No. While support levels are valuable, they should be used in conjunction with other technical tools, such as volume analysis, candlestick patterns, and momentum indicators. Relying solely on support can lead to false signals, especially in choppy or news-driven markets.
Disclaimer: This content is for educational purposes only and does not constitute financial or investment advice. Investments in securities or other financial instruments are subject to market risk, including partial or total loss of capital. Past performance is not indicative of future results. Always consider your financial situation carefully and consult a licensed financial advisor before making investment or trading decisions.
Engineered for the obsessed. Built for traders.

Purpose-built terminals.
Zero compromise.
Built for speed.
Plot No 1290, 2nd Floor, 17th Cross, 5th Main, Sector-7, HSR Layout, Bangalore 560102
Follow us on
Mintcap Brokers Private Limited
CIN – U66110KA2023PTC178706 | Registered Address: Plot No 1290, Second Floor, 17th Cross, 5th Main, Sector-7, HSR Layout, Bangalore 560102 | Tel: 080 – 49552310 | Email ID: compliance@capmint.com | SEBI registered Stock Broker: INZ000322732 | NSE Cash/F&O Member ID: 90430 | BSE Cash/F&O Member ID: 6903 | MCX Member ID: 57400 | NCDEX Member ID: 1312 | SEBI registered Depository Participant: IN-DP-806-2025 | CDSL DP ID: 12102300 | NSE Clearing Member code: M70108 | AMFI-Registered Mutual Fund Distributor: ARN-289109 (Valid upto 28-Feb-2027) | Category II Execution Only Platform : E6903
Details of Client Bank Account
Compliance Officer: Ms. Shridevi Vungarala | Email ID: compliance@capmint.com | Tel no. + 91 9035330126 | Grievance Redressal Officer (GRO) – Ms. Shikha Gupta | Email ID: Grievance@capmint.com | Tel no: 9035331595.
Procedure to file a complaint on SEBI SCORES: Register on SCORES portal. Mandatory details for filing complaints on SCORES: Name, PAN, Address, Mobile Number, E-mail ID. Benefits: Effective Communication, Speedy redressal of the grievances. You may refer the website https://scores.sebi.gov.in/ for more information. You may also download the SEBI Scores app to log a complaint Android: https://play.google.com > store > apps > sebiscores iOS: https://apps.apple.com > app > sebiscores
Disclaimer
Investment in the securities market are subject to market risks, read all the related documents carefully before investing. Brokerage will not exceed the SEBI prescribed limit.
Mutual fund investments are subject to market risks, read all scheme related documents carefully before investing. Mutual Funds are not exchange-traded products.
Attention Investor:
- Stock Brokers can accept securities as margin from clients only by way of pledge in the depository system w.e.f. September 1, 2020.
- Update your mobile number & email Id with your stock broker/depository participant and receive OTP directly from depository on your email id and/or mobile number to create pledge.
- Pay 20% as upfront margin of the transaction value to trade in cash market segment.
- Investors may please refer to the Exchange’s Frequently Asked Questions (FAQs) issued vide circular reference NSE/INSP/45191 dated July 31, 2020 and NSE/INSP/45534 dated August 31, 2020 and other guidelines issued from time to time in this regard.
- Check your Securities /MF/ Bonds in the consolidated account statement issued by NSDL/CDSL every month.