
Table of Content
- Key Takeaways
- What Is R-squared?
- How is R-squared calculated?
- Interpreting R-squared Values
- R-squared vs. Alpha vs. Beta – Comparison Table
- Why R-squared Matters in Stock & Mutual Fund Investing?
- Limitations of R-Squared?
- How to Improve R-Squared?
- When to Prefer High vs Low R-squared?
- Conclusion
- Frequently Asked Questions (FAQs)
Link copied!
R-Squared
R-squared, also known as the coefficient of determination, is a number between 0 and 100 (or 0.0 to 1.0 in decimal form) that tells us how much of a fund’s or stock’s returns can be explained by the market movements.
Key Takeaways
- R-squared shows a fund’s link to the market.
It’s a number between 0 and 100 that shows whether a fund is copying the market or doing something different. - A high R-squared means the fund is behaving like the market.
If a fund has a high R-squared, it is following the index closely. It’s more predictable and works well for passive investing. - Low R-squared means the fund is taking its own path.
The fund is not copying the market and may be investing in different areas. This can bring diversification, but also more risk. - R-squared helps you make smarter investment decisions.
It helps check fund manager performance, choose the right mix of funds, and build a portfolio that fits your goals and risk level.
What Is R-squared?
R-squared shows how closely a stock or mutual fund moves in relation to a benchmark index like Nifty 50 or Sensex. It helps us understand a fund’s behaviour by telling us whether the fund is following the market or doing something different.
If the R-squared is high, it means the fund is moving almost like the index. If it is low, the fund is taking its own path and making independent bets, which may or may not work out.
R-squared also helps in diversification and risk assessment. A fund with a low R-squared can add variety to your portfolio because it doesn’t move exactly like the market. But that also means its performance can be unpredictable. On the other hand, a fund with a high R-squared is easier to track and gives more predictable results because it sticks close to the index.
How is R-squared calculated?
R-squared measures how much of the fund’s returns can be explained by the benchmark index’s returns. It is calculated using a statistical method called regression analysis.
Simple Formula: R² = (Correlation between fund and index)²
So, if the correlation between a mutual fund and the index is 0.9, then:
R² = 0.9 × 0.9 = 0.81 Or R² = 81%
This means the index can explain 81% of the fund’s movement.
Example Of R-Squared
Let’s say we’re tracking the returns of the Nifty 50 and a mutual fund over 4 months:
|
Month |
Nifty Return |
Fund Return |
|---|---|---|
|
January |
10% |
9% |
|
February |
5% |
4.50% |
|
March |
-3% |
-2.70% |
|
April |
8% |
7.20% |
Here, the fund is consistently moving in the same direction as the index and has similar values. The correlation is very high, let’s say around 0.98.
So R-squared = 0.98 × 0.98 = 0.96 or 96%
This means that the index’s movements can explain 96% of the fund’s returns. The fund basically follows the market and does not do anything very different.
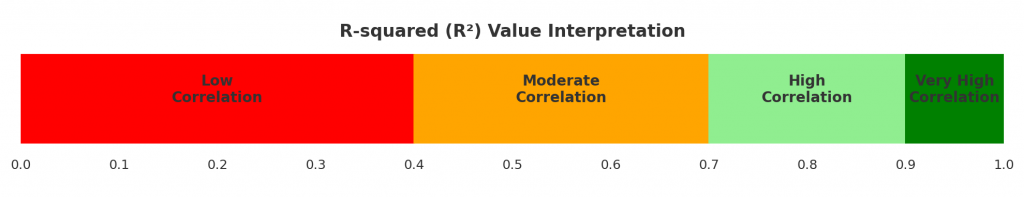
Interpreting R-squared Values
R-squared ranges from 0 to 1 (or 0% to 100%), and it tells us how closely a mutual fund or stock follows its benchmark index. Here is a table of R-squared Value Interpretation:
|
R² Range |
Interpretation |
What It Indicates for Investors |
|---|---|---|
|
0.00 – 0.40 |
Very low correlation. The fund’s performance has little connection with the benchmark index and tends to move independently. |
This may indicate active management or exposure to unique sectors and strategies. Such funds can behave very differently from the broader market and may offer diversification benefits, but they can also carry higher unpredictability. |
|
0.41 – 0.70 |
Moderate correlation. The fund is partially influenced by the benchmark but still shows noticeable independent movement. |
These funds balance benchmark exposure with active decision-making. Investors may experience returns that differ from the index while still benefiting from general market trends. |
|
0.71 – 0.90 |
High correlation. The fund generally follows the movements of the benchmark index. |
This suggests the fund’s performance is strongly linked to the market or benchmark. It may suit investors looking for returns that broadly align with market performance while still allowing for some active management. |
|
0.91 – 1.00 |
Very high correlation. The fund closely mirrors the benchmark index, similar to an index fund. |
Funds in this range tend to behave almost identically to the index. This indicates very low deviation from benchmark performance and is common in passive or index-based investment strategies. |
Here is a visual representation of R-Squared
Why R-squared Matters in Stock & Mutual Fund Investing?
But looking at returns alone doesn’t tell you the full story. To really understand how well a stock or mutual fund is performing, one key metric matters more than most: R-squared. Here’s why it’s important.
R-squared helps judge how closely a fund follows its benchmark.
R-squared helps judge how closely a mutual fund follows its benchmark index. It is a metric available for every mutual fund. If the R-squared value is high (close to 1 or 100%), it means the fund is moving almost exactly like the index. In this case, the fund is not doing anything very different and is basically just tracking the market. On the other hand, if the R-squared value is low, it means the fund is taking its own path and investing differently from the benchmark.
R-squared Helps In Analysing Fund Manager Performance
R-squared also helps in analysing fund manager performance. Alpha is the extra return that a fund manager generates compared to the benchmark. If a fund shows high alpha but has a low R-squared, it means the returns may be coming from independent or unrelated bets rather than skilful decisions against the index. In such cases, alpha might not be reliable. However, when the R-squared is high, alpha becomes a more meaningful and accurate measure of the fund manager’s performance.
Helps In Making Portfolio Diversification
R-squared helps in portfolio diversification by showing how closely a fund’s performance is linked to its benchmark index. When building a diversified portfolio, it’s important to include investments that don’t all move in the same direction.
If all funds have a high R-squared, they are likely to react similarly to market changes, which reduces the benefits of diversification. Including funds with lower R-squared values introduces assets that behave differently, helping to spread risk and reduce overall portfolio volatility.
Limitations of R-Squared?
While R-squared is a useful metric, it also has certain limitations that investors should understand before relying on it completely:
Does not measure performance:
A high R-squared does not mean a fund is generating better returns. It only shows how closely the fund follows the benchmark index.
Cannot predict future returns:
R-squared is based on historical data, so it may not accurately reflect future market behaviour or fund performance.
May ignore active management quality:
A low R-squared can indicate diversification, but it may also mean inconsistent or risky investment decisions by the fund manager.
Works best with Alpha and Beta:
R-squared alone does not provide a complete picture. It should be analysed together with metrics like Alpha and Beta for better evaluation.
Less useful for unique funds:
Sectoral, thematic, or international funds may naturally have lower R-squared values, making benchmark comparison less meaningful.
How to Improve R-Squared?
Improving R-squared generally means increasing the alignment between a fund and its benchmark index. Here are some ways this can happen:
Increase benchmark exposure:
Funds that invest more heavily in benchmark stocks tend to show a higher R-squared value.
Reduce highly independent bets:
Limiting investments that move very differently from the index can improve correlation with the benchmark.
Maintain a consistent investment strategy:
A stable and disciplined portfolio strategy often results in returns that align more closely with the market.
Check out more about Portfolio Management.
Use a more relevant benchmark:
Choosing the correct benchmark for comparison can improve the accuracy and usefulness of the R-squared value.
Diversify within the benchmark universe:
Holding a broader mix of stocks from the benchmark index may increase the fund’s similarity to market movements.
💡 Insight:
A higher R-squared is not always better. The ideal value depends on whether the investor wants market-like stability or independent, actively managed returns.
When to Prefer High vs Low R-squared?
The right R-squared level depends on whether you want your fund to mirror the market or to take its own path.
High R-squared: Best for Index and Large-Cap Funds
If your goal is to stay close to the market, a high R-squared works best.
A high R-squared (close to 1 or 100%) is preferred when you want returns that closely follow the market. This is suitable for passive investing, where the goal is to match the performance of the benchmark index with minimal risk and cost. Index funds and large-cap mutual funds often have high R-squared values, making them ideal for investors who prefer stability and predictability.
Low R-squared: Best for Thematic and Sector Funds
On the other hand, a low R-squared is better if you want something different from the market.
It indicates that the fund is not closely following the benchmark and may be taking independent positions. This can be useful for adding variety to your portfolio and reducing dependency on market movements. It is often seen in thematic funds, sector funds, or funds with a unique investment approach.
How to Choose: Stability vs Active Bets?
So, the final choice depends on what you want from your investments.
If you want market-like returns with low tracking error, go with high R-squared. If you want to add different sources of returns and take some active risk, a low R-squared can be more suitable.
Conclusion
R-squared is a powerful yet often overlooked metric that helps investors understand how closely a stock or mutual fund mirrors the broader market. While a high R-squared indicates stability and market-like returns, a low R-squared can offer diversification and active management potential. However, it’s not a measure of performance on its own; it should be used alongside metrics like Alpha and Beta to get the full picture. Whether you’re a passive investor seeking consistency or an active one looking for unique opportunities, understanding R-squared can guide smarter portfolio decisions and help align investments with your financial goals.
Frequently Asked Questions (FAQs)
What does R-squared tell you?
R-squared shows how closely a mutual fund’s returns move in line with its benchmark index. A higher value means the fund is closely tracking the index, while a lower value means it is moving differently.
What does an R² value of 0.9 mean?
An R² of 0.9 (or 90%) means the fund’s returns move almost exactly like the benchmark. In this case, the fund is behaving very similarly to the index and offers little deviation.
What if R² is close to 1?
If R² is close to 1 (or 100%), it means the fund is nearly identical to the benchmark in terms of movements. Such a fund is essentially tracking the market and is best suited for investors looking for stability and predictable returns.
Can R-Squared be Negative?
No, R-squared cannot be negative in its standard form. It ranges between 0 and 1 (or 0% to 100%). A value closer to 0 means the fund has little connection with the benchmark, while a value closer to 1 means it closely follows the index.
Is a Higher R-Squared Better?
Not always. A higher R-squared is better for investors seeking stable, market-like returns, such as through index funds. A lower R-squared may be preferable for investors looking for diversification or actively managed funds that take independent investment positions.
Disclaimer: This content is for educational purposes only and does not constitute financial or investment advice. Investments in securities or other financial instruments are subject to market risk, including partial or total loss of capital. Past performance is not indicative of future results. Always consider your financial situation carefully and consult a licensed financial advisor before making investment or trading decisions.
Table of Content
- Key Takeaways
- What Is R-squared?
- How is R-squared calculated?
- Interpreting R-squared Values
- R-squared vs. Alpha vs. Beta – Comparison Table
- Why R-squared Matters in Stock & Mutual Fund Investing?
- Limitations of R-Squared?
- How to Improve R-Squared?
- When to Prefer High vs Low R-squared?
- Conclusion
- Frequently Asked Questions (FAQs)
Engineered for the obsessed. Built for traders.

Purpose-built terminals.
Zero compromise.
Built for speed.
Plot No 1290, 2nd Floor, 17th Cross, 5th Main, Sector-7, HSR Layout, Bangalore 560102
Follow us on
Mintcap Brokers Private Limited
CIN – U66110KA2023PTC178706 | Registered Address: Plot No 1290, Second Floor, 17th Cross, 5th Main, Sector-7, HSR Layout, Bangalore 560102 | Tel: 080 – 49552310 | Email ID: compliance@capmint.com | SEBI registered Stock Broker: INZ000322732 | NSE Cash/F&O Member ID: 90430 | BSE Cash/F&O Member ID: 6903 | MCX Member ID: 57400 | NCDEX Member ID: 1312 | SEBI registered Depository Participant: IN-DP-806-2025 | CDSL DP ID: 12102300 | NSE Clearing Member code: M70108 | AMFI-Registered Mutual Fund Distributor: ARN-289109 (Valid upto 28-Feb-2027) | Category II Execution Only Platform : E6903
Details of Client Bank Account
Compliance Officer: Ms. Shridevi Vungarala | Email ID: compliance@capmint.com | Tel no. + 91 9035330126 | Grievance Redressal Officer (GRO) – Ms. Shikha Gupta | Email ID: Grievance@capmint.com | Tel no: 9035331595.
Procedure to file a complaint on SEBI SCORES: Register on SCORES portal. Mandatory details for filing complaints on SCORES: Name, PAN, Address, Mobile Number, E-mail ID. Benefits: Effective Communication, Speedy redressal of the grievances. You may refer the website https://scores.sebi.gov.in/ for more information. You may also download the SEBI Scores app to log a complaint Android: https://play.google.com > store > apps > sebiscores iOS: https://apps.apple.com > app > sebiscores
Disclaimer
Investment in the securities market are subject to market risks, read all the related documents carefully before investing. Brokerage will not exceed the SEBI prescribed limit.
Mutual fund investments are subject to market risks, read all scheme related documents carefully before investing. Mutual Funds are not exchange-traded products.
Attention Investor:
- Stock Brokers can accept securities as margin from clients only by way of pledge in the depository system w.e.f. September 1, 2020.
- Update your mobile number & email Id with your stock broker/depository participant and receive OTP directly from depository on your email id and/or mobile number to create pledge.
- Pay 20% as upfront margin of the transaction value to trade in cash market segment.
- Investors may please refer to the Exchange’s Frequently Asked Questions (FAQs) issued vide circular reference NSE/INSP/45191 dated July 31, 2020 and NSE/INSP/45534 dated August 31, 2020 and other guidelines issued from time to time in this regard.
- Check your Securities /MF/ Bonds in the consolidated account statement issued by NSDL/CDSL every month.