

Table of Content
- Bull Market vs Bear Market: At a Glance
- What Is a Bull Market?
- What Is a Bear Market?
- Why Are Markets Called Bull and Bear Markets?
- What Does Bullish and Bearish Mean?
- How Bull and Bear Markets Actually Behave
- How to Identify a Bull or Bear Market
- Bull vs Bear Market: The Psychology Nobody Escapes
- Strategies for Bull and Bear Markets
- Bull Market Within a Bear Market? Yes, It Happens
- Common Mistakes Investors Make in Bull and Bear Markets
- Bull or Bear: Which Market Is Better?
- The Honest Conclusion
- Frequently Asked Questions
- Further Reads
Link copied!
Bull Market vs Bear Market: How to Identify Market Trends

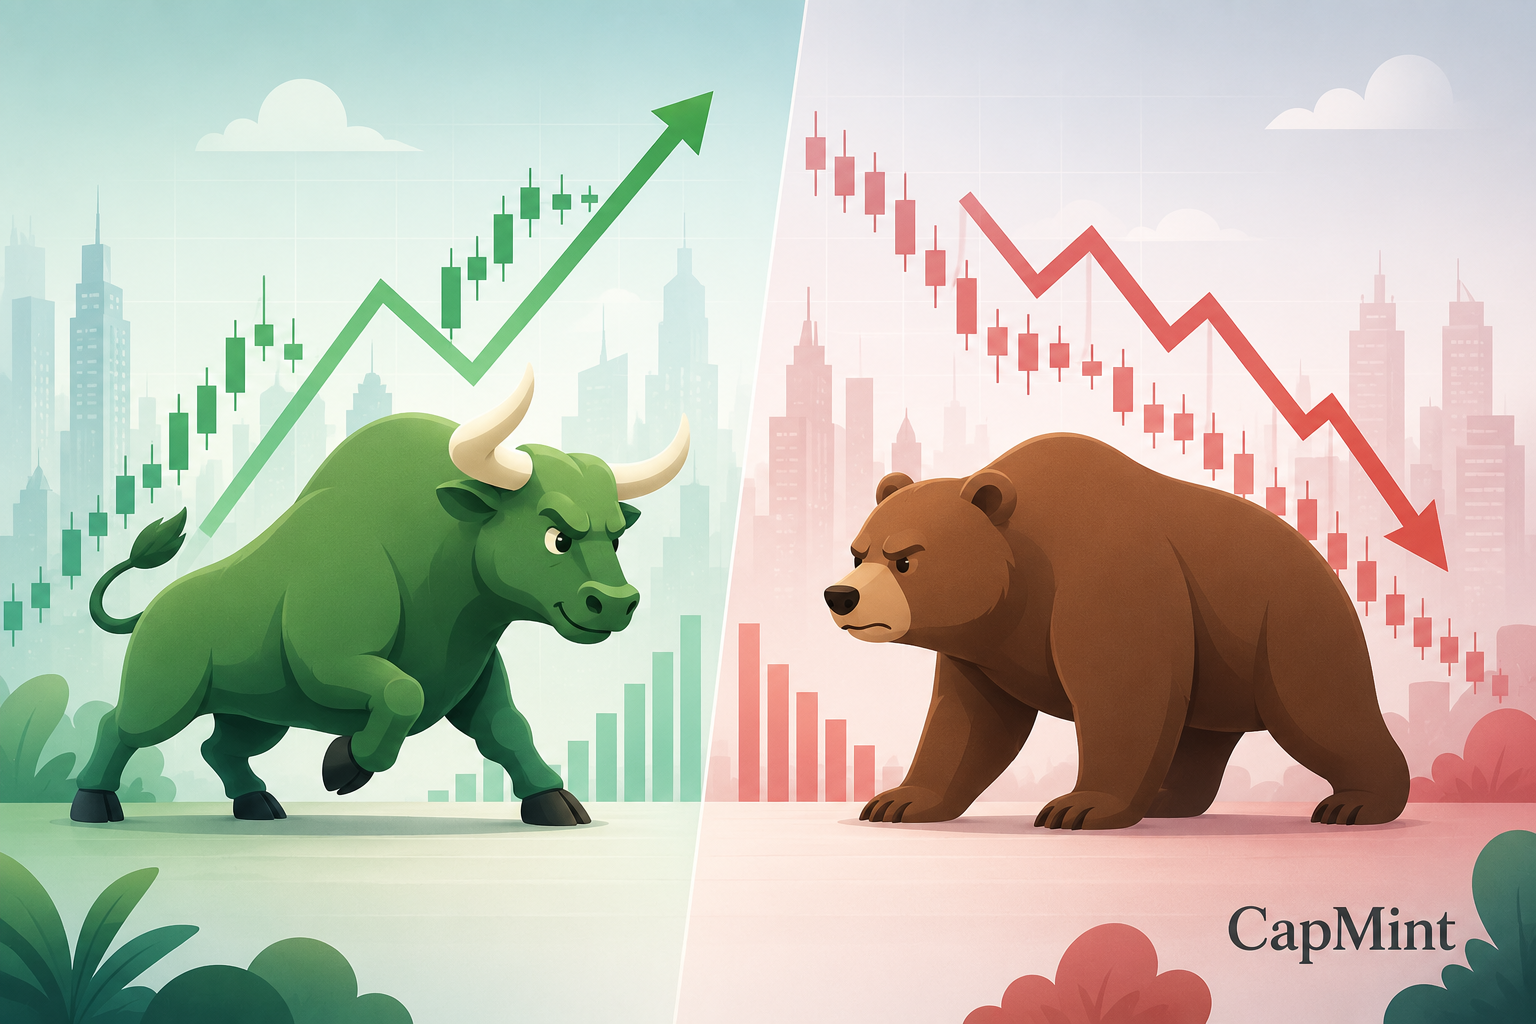
Markets do not move in straight lines.
Prices rise, confidence builds, and investors begin believing the good times will continue. Then something changes. Growth slows, uncertainty enters the market, and the same investors who were aggressively buying a few months ago suddenly become cautious.
This is the basic cycle behind bull and bear markets.
On the surface, the difference seems obvious. A bull market goes up. A bear market goes down. But that explanation misses the part that actually matters to investors.
The difficult part is recognising what kind of market you are in while you are still living through it.
A 10% decline could be a temporary correction in a larger bull market. A 15% rally could be the beginning of a new bull market or simply a short-lived recovery inside a larger bear market. Markets rarely announce when one phase has ended, and another has begun.
This is why understanding the difference between bull and bear markets requires more than memorising the 20% rule. You need to understand price trends, market participation, economic conditions, investor psychology, and, most importantly, how your own behaviour changes when the market changes.
If you want the quick comparison, start here.
Bull Market vs Bear Market: At a Glance
|
Dimension |
Bull Market |
Bear Market |
|---|---|---|
|
Price Direction |
Sustained upward trend |
Sustained downward trend |
|
Common Benchmark |
Around 20% rise from recent lows |
Around 20% decline from recent highs |
|
Investor Sentiment |
Optimism and confidence |
Fear and pessimism |
|
Economic Environment |
Often associated with economic expansion |
Often associated with slowing economic activity |
|
Corporate Earnings |
Generally improving |
Often under pressure |
|
Market Participation |
Buying interest broadens |
Selling pressure increases |
|
Risk Appetite |
Investors become more willing to take risks |
Investors become more defensive |
|
Common Strategy |
Buying, holding, and participating in trends |
Capital preservation, diversification, and selective buying |
|
Primary Psychological Risk |
Overconfidence and FOMO |
Panic and excessive pessimism |
|
Biggest Investor Mistake |
Assuming prices will rise forever |
Selling quality investments purely out of fear |
This table explains the structural difference.
But the real difference is psychological.
Bull markets make investors believe risk has disappeared. Bear markets make them believe opportunity has disappeared.
Both beliefs can become expensive.
What Is a Bull Market?
A bull market is a sustained period during which the prices of stocks, indices, or other financial assets generally move higher.
A rise of approximately 20% from a recent low is commonly used as a benchmark for identifying a bull market, although there is no universal rule that perfectly defines when one begins.
What matters more is the underlying behaviour of the market.
In a healthy bull market, major indices such as the Nifty 50 or Sensex generally form higher highs and higher lows. Corporate earnings may improve, economic activity may strengthen, and investors may become increasingly willing to put money into equities.
At first, the rally may be driven by experienced investors who believe conditions are improving. As prices continue rising, confidence spreads. More investors enter the market. Financial news becomes increasingly positive. Risk appetite grows.
Eventually, people who previously had little interest in investing begin asking which stocks they should buy.
That is the interesting thing about bull markets. Rising prices do not simply reflect optimism. They create more optimism.
This feedback loop can continue for months or even years.
But it also creates one of the biggest risks of a bull market: the belief that making money has become easy.
It has not.
The market environment has simply become more forgiving.
What Is a Bear Market?
A bear market is generally defined as a sustained decline of 20% or more from recent market highs.
But again, the percentage is only part of the story.
A real bear market changes investor behaviour.
As prices fall, confidence begins to disappear. Investors become more cautious. Traders reduce their exposure. Negative economic news receives more attention, and companies with weak fundamentals or excessive valuations may experience particularly sharp declines.
Psychology can become self-reinforcing.
Falling prices create fear. Fear creates selling. Selling pushes prices lower, which creates even more fear.
The result is often a market environment where investors begin questioning decisions they were completely confident about only months earlier.
This is where bear markets become psychologically difficult.
Watching your portfolio decline by 20%, 30%, or more is very different from reading about market cycles in a textbook. Every negative headline suddenly feels important. Every further decline feels like confirmation that selling might be the safest decision.
The challenge is that by the time fear becomes extreme, much of the decline may have already happened.
Bear markets do not just test portfolios.
They test conviction.
Why Are Markets Called Bull and Bear Markets?
The most common explanation comes from the way the two animals attack.
A bull thrusts its horns upward, representing rising prices. A bear swipes its paws downward, representing falling prices.
The origin of the term “bear” in financial markets can also be traced to the expression about selling the bear’s skin before catching the bear. The phrase became associated with speculators who sold assets they did not own in anticipation of falling prices.
Over time, bulls and bears became universal symbols of opposing market expectations.
The imagery survived because it explains the difference remarkably well.
Bulls push prices higher.
Bears drag them lower.
What Does Bullish and Bearish Mean?
Bullish and bearish describe expectations about future price direction.
If an investor is bullish, they expect the price of an asset, sector, or overall market to rise. A bullish investor may purchase shares, increase equity exposure, or hold existing investments because they expect future gains.
A bearish investor expects prices to decline. They may reduce exposure, move towards defensive assets, hedge existing positions, or avoid entering new investments.
The important distinction is that a person can be bullish or bearish without the entire market being in a bull or bear market.
You could be bullish on banking stocks while being bearish on the broader market. A trader could also hold a bearish view for the next week while remaining bullish on the market’s long-term prospects.
These words describe expectations.
Bull and bear markets describe broader market conditions.
How Bull and Bear Markets Actually Behave
The textbook version says bull markets rise and bear markets fall.
The market version is messier.
Bull markets contain corrections. Bear markets contain powerful rallies. Some of the fastest upward moves in history have occurred during larger bear markets because short covering, extreme pessimism, and sudden changes in expectations can trigger aggressive recoveries.
This is why identifying a market cycle based on a few days of price action is dangerous.
Bull Markets Usually Build Confidence Gradually
Bull markets often develop over extended periods as earnings improve, economic expectations strengthen, liquidity enters the market, and investors become more willing to accept risk.
As the trend continues, participation can broaden from large-cap stocks to mid-cap and small-cap companies.
Eventually, the psychology changes.
Investors stop asking whether they should invest and start worrying that they are not invested enough.
That is where FOMO enters the market.
Bear Markets Can Destroy Confidence Quickly
Bear markets often feel faster because fear spreads differently from optimism.
Investors may take months to become confident enough to invest aggressively, but a sudden economic shock, geopolitical event, financial crisis, or unexpected change in expectations can trigger selling within days.
The COVID-19 crash of 2020 demonstrated this clearly. Indian and global equity markets experienced an extraordinarily rapid decline as uncertainty spread across the world.
Bull markets often climb gradually.
Bear markets can take the elevator down.
How to Identify a Bull or Bear Market
Markets do not send a notification saying the bull market has ended.
Identifying a trend requires looking at multiple signals together rather than relying on one indicator.
1. Look at the Market Structure
Price structure is one of the simplest ways to understand market direction.
A healthy upward trend generally creates higher highs and higher lows. Buyers repeatedly push prices above previous highs while corrections stop above previous major lows.
A downward trend generally produces lower highs and lower lows.
The concept is simple.
The execution is not.
Market structure becomes much easier to identify in hindsight, which is why investors should examine broader trends rather than reacting to every short-term move.
2. Watch Moving Averages
Moving averages help smooth short-term price fluctuations and reveal the broader trend.
If a major index remains above important long-term moving averages, particularly with the averages themselves trending upward, the market may be experiencing bullish conditions.
Sustained trading below important moving averages can indicate weakening momentum or bearish conditions.
But moving averages are confirmation tools.
They tell you what the market has been doing. They do not predict the future.
3. Examine Market Breadth
This is where the analysis becomes more useful.
Suppose the Nifty 50 is rising, but only a handful of large companies are responsible for most of the gains. The index looks strong, but participation beneath the surface is weak.
Now compare that with a market where large-cap, mid-cap, and small-cap stocks are rising together, and the number of advancing stocks consistently exceeds declining stocks.
The second rally has broader participation.
Healthy bull markets generally benefit from expanding market breadth. Weakening breadth can indicate that an upward trend is losing strength even before the major index begins falling.
The index tells you where the market is.
Breadth tells you how many stocks helped it get there.
4. Observe Volume and Momentum
Rising prices supported by healthy trading volume can indicate strong participation.
Similarly, persistent selling accompanied by increasing volume may signal growing bearish conviction.
Momentum indicators such as the RSI, MACD, and other technical tools can also provide additional context.
But no indicator should be treated as a market oracle.
A technical indicator is evidence.
It is not a verdict.
5. Watch the Economic Environment
Stock markets and economies are connected, but they do not move in perfect synchronisation.
Bull markets are often associated with improving corporate earnings, stronger economic growth, favourable liquidity conditions, and rising investor confidence.
Bear markets may occur alongside slowing growth, declining earnings expectations, tighter monetary conditions, financial crises, or major economic uncertainty.
But here is where many investors get confused.
Markets are forward-looking.
The stock market can begin rising while economic news still looks terrible because investors expect conditions to improve in the future. Similarly, markets can begin declining while economic data remains strong because investors expect future conditions to deteriorate.
The market trades expectations.
Not headlines.
Bull vs Bear Market: The Psychology Nobody Escapes
This is the part that matters more than most indicators.
Bull markets reward participation, but they also encourage overconfidence.
After watching prices rise repeatedly, investors begin believing they have become better at selecting stocks. Risk management starts feeling unnecessary. Valuations are ignored because “the stock will keep going up.”
Eventually, speculation gets mistaken for skill.
Bear markets create the opposite problem.
Losses make investors defensive. Investors who were aggressively buying at high prices suddenly become unwilling to buy the same businesses at lower prices. Every negative headline feels like another reason to stay away.
This creates one of the strangest patterns in investing.
People become more interested in buying stocks after prices have already risen significantly and less interested after prices have fallen.
The market changes.
Human psychology does not.
Strategies for Bull and Bear Markets
There is no single strategy that works for every investor or every market cycle.
But the environment should influence how you think about risk.
During a Bull Market
A bull market generally rewards investors who participate in sustained trends and remain invested in fundamentally strong businesses.
Growth stocks and cyclical sectors may perform well as confidence and economic activity improve. Momentum strategies can also benefit from persistent upward trends.
But bull markets require discipline.
The longer prices rise, the easier it becomes to justify excessive valuations, oversized positions, and unnecessary leverage.
The goal is not simply to make money while markets rise.
It is to avoid giving it all back when conditions change.
During a Bear Market
Bear markets shift the priority from aggressive return generation towards risk management and capital preservation.
Some investors increase exposure to cash, fixed-income securities, gold, defensive sectors, or dividend-paying companies. Experienced market participants may also use derivatives to hedge portfolios.
Long-term investors may view substantial market declines differently.
If the underlying businesses remain financially strong, lower prices can create opportunities to accumulate quality investments gradually.
But “buy the dip” is not a strategy by itself.
A stock that has fallen 50% can fall another 50%.
Price declines create opportunities only when the underlying investment thesis remains valid.
Bull Market Within a Bear Market? Yes, It Happens
This is where market labels become dangerous.
A larger bull market can contain sharp corrections. A larger bear market can contain aggressive rallies.
These counter-trend moves can be convincing enough to make investors believe the entire market cycle has changed.
A 15% rally inside a bear market can feel like the beginning of a new bull market. A 10% correction inside a long-term bull market can feel like the beginning of a crash.
This is why context matters.
Do not judge the entire market cycle using a few trading sessions.
Zoom out.
Look at the broader price structure, economic environment, market breadth, earnings expectations, and investor behaviour.
The timeframe changes the answer.
Common Mistakes Investors Make in Bull and Bear Markets
Assuming a Bull Market Will Continue Forever
Every bull market eventually ends.
Investors who forget this often increase their risk exposure precisely when valuations and optimism are becoming excessive.
Panic-Selling During Market Declines
Selling because your investment thesis has changed is rational.
Selling simply because prices are falling is emotional.
The difference between the two can determine long-term investment outcomes.
Relying Entirely on the 20% Rule
The 20% threshold is a convention.
Markets do not change their behaviour because an index moved from -19.9% to -20%.
Use the rule as a reference point, not a trading signal.
Confusing a Rally With a New Bull Market
Bear market rallies can be sharp and convincing.
A few weeks of rising prices do not automatically confirm that the larger downward trend has ended.
Trying to Predict the Exact Market Bottom
Everyone wants to buy at the bottom.
Almost nobody consistently does.
Waiting for perfect certainty often means missing a significant portion of the recovery because markets typically begin rising before the economic environment feels comfortable again.
Bull or Bear: Which Market Is Better?
The obvious answer is a bull market.
Most investors prefer rising portfolios.
But the more useful answer depends on where you are in your investment journey.
Bull markets reward existing investors because the value of their holdings increases. Bear markets can create opportunities for investors who have capital, patience, and the ability to evaluate businesses objectively.
One builds wealth.
The other can create the conditions for future wealth.
The problem is that investors often behave in exactly the wrong way during both.
They become greedy when prices are high and fearful when prices are low.
The market cycle is difficult.
The emotional cycle is worse.
The Honest Conclusion
Bull and bear markets are not simply periods when prices go up or down.
They are environments that change how investors think.
Bull markets make risk feel smaller than it actually is. Bear markets make opportunities feel more dangerous than they actually are.
Neither environment lasts forever.
The investor’s job is not to perfectly predict when one market phase will end, and another will begin. That is a game even experienced market participants struggle to win consistently.
The job is simpler, but not easier.
Understand the broader trend. Watch market participation. Evaluate economic and business fundamentals. Manage your risk. And avoid allowing the mood of the market to make your decisions for you.
Most investors do not struggle because they cannot identify a bull or bear on a chart.
They struggle because their confidence rises and falls with prices.
When the market is rising, they feel invincible.
When it is falling, they feel helpless.
The market will continue moving between optimism and fear.
Your advantage comes from not moving emotionally with it.
Frequently Asked Questions
What is the difference between a bull market and a bear market?
A bull market is a sustained period of rising asset prices accompanied by improving investor confidence, while a bear market generally refers to a decline of 20% or more from recent highs. The bigger difference lies in investor psychology: optimism and risk-taking dominate bull markets, while fear and caution dominate bear markets.
Which is better, a bull or bear market?
Bull markets are generally favourable for existing investors because asset prices rise. However, bear markets can create opportunities to purchase fundamentally strong investments at lower valuations. Which environment is “better” depends on an investor’s objectives, available capital, risk tolerance, and investment horizon.
Is India currently in a bull or bear market?
The answer depends on the index, asset class, and timeframe being analysed. A short-term correction can occur within a long-term bull market, while a temporary rally can occur during a larger bear market. Investors should examine broader trends, market breadth, economic conditions, and price structure rather than relying only on recent market movements.
What does 100% bullish mean?
Being 100% bullish generally means an investor or analyst strongly expects prices to rise. However, the phrase describes an opinion or level of confidence rather than a guarantee about future market performance.
Is it better to buy in a bullish or bearish market?
Neither market phase automatically provides better buying opportunities. Bull markets offer strong momentum but can involve higher valuations, while bear markets may provide lower prices alongside greater uncertainty. Investors should focus on investment quality, valuation, risk tolerance, and time horizon rather than making decisions based only on the market label.
How long do bull and bear markets last?
There is no fixed duration. Bull markets can continue for several years, while bear markets are often shorter but can produce rapid and significant declines. The length of each cycle depends on economic conditions, earnings growth, monetary policy, liquidity, and investor sentiment.
Can a bull market have corrections?
Yes. Corrections are normal even during long-term bull markets. A temporary decline does not automatically mean the bull market has ended. Investors should analyse the broader market structure and underlying conditions before concluding that the larger trend has reversed.
Can you make money in a bear market?
Yes, although doing so can be more difficult and risky. Some investors focus on defensive assets, hedging strategies, or selective accumulation of fundamentally strong companies at lower valuations. Short selling and derivatives can also be used by experienced traders, but they involve significant risks and require careful risk management.
Further Reads
Disclaimer: This content is for educational purposes only and does not constitute financial or investment advice. Investments in securities or other financial instruments are subject to market risk, including partial or total loss of capital. Past performance is not indicative of future results. Always consider your financial situation carefully and consult a licensed financial advisor before making investment or trading decisions.
Table of Content
- Bull Market vs Bear Market: At a Glance
- What Is a Bull Market?
- What Is a Bear Market?
- Why Are Markets Called Bull and Bear Markets?
- What Does Bullish and Bearish Mean?
- How Bull and Bear Markets Actually Behave
- How to Identify a Bull or Bear Market
- Bull vs Bear Market: The Psychology Nobody Escapes
- Strategies for Bull and Bear Markets
- Bull Market Within a Bear Market? Yes, It Happens
- Common Mistakes Investors Make in Bull and Bear Markets
- Bull or Bear: Which Market Is Better?
- The Honest Conclusion
- Frequently Asked Questions
- Further Reads
Engineered for the obsessed. Built for traders.

Purpose-built terminals.
Zero compromise.
Built for speed.

Plot No 1290, 2nd Floor, 17th Cross, 5th Main, Sector-7, HSR Layout, Bangalore 560102
Follow us on


Mintcap Brokers Private Limited
CIN – U66110KA2023PTC178706 | Registered Address: Plot No 1290, Second Floor, 17th Cross, 5th Main, Sector-7, HSR Layout, Bangalore 560102 | Tel: 080 – 49552310 | Email ID: compliance@capmint.com | SEBI registered Stock Broker: INZ000322732 | NSE Cash/F&O Member ID: 90430 | BSE Cash/F&O Member ID: 6903 | MCX Member ID: 57400 | NCDEX Member ID: 1312 | SEBI registered Depository Participant: IN-DP-806-2025 | CDSL DP ID: 12102300 | NSE Clearing Member code: M70108 | AMFI-Registered Mutual Fund Distributor: ARN-289109 (Valid upto 28-Feb-2027) | Category II Execution Only Platform : E6903
Details of Client Bank Account
Compliance Officer: Ms. Shridevi Vungarala | Email ID: compliance@capmint.com | Tel no. + 91 9035330126 | Grievance Redressal Officer (GRO) – Ms. Shikha Gupta | Email ID: Grievance@capmint.com | Tel no: 9035331595.
Procedure to file a complaint on SEBI SCORES: Register on SCORES portal. Mandatory details for filing complaints on SCORES: Name, PAN, Address, Mobile Number, E-mail ID. Benefits: Effective Communication, Speedy redressal of the grievances. You may refer the website https://scores.sebi.gov.in/ for more information. You may also download the SEBI Scores app to log a complaint Android: https://play.google.com > store > apps > sebiscores iOS: https://apps.apple.com > app > sebiscores
Disclaimer
Investment in the securities market are subject to market risks, read all the related documents carefully before investing. Brokerage will not exceed the SEBI prescribed limit.
Mutual fund investments are subject to market risks, read all scheme related documents carefully before investing. Mutual Funds are not exchange-traded products.
Attention Investor:
- Stock Brokers can accept securities as margin from clients only by way of pledge in the depository system w.e.f. September 1, 2020.
- Update your mobile number & email Id with your stock broker/depository participant and receive OTP directly from depository on your email id and/or mobile number to create pledge.
- Pay 20% as upfront margin of the transaction value to trade in cash market segment.
- Investors may please refer to the Exchange’s Frequently Asked Questions (FAQs) issued vide circular reference NSE/INSP/45191 dated July 31, 2020 and NSE/INSP/45534 dated August 31, 2020 and other guidelines issued from time to time in this regard.
- Check your Securities /MF/ Bonds in the consolidated account statement issued by NSDL/CDSL every month.