
Table of Content
Link copied!
Debt-to-Equity (D/E) Ratio
The Debt-to-Equity (DE) Ratio is a financial ratio that compares a company’s total debt with its shareholders’ equity to measure how much the business relies on borrowed funds versus owner capital for financing its operations and growth.
Key Takeaways
- The Debt-to-Equity (D/E) ratio measures how much a company relies on debt compared to shareholders’ equity to finance its operations and growth.
- A lower D/E ratio generally indicates conservative financial management and lower financial risk, while a higher ratio may suggest greater dependence on borrowed funds.
- The ideal Debt-to-Equity ratio varies across industries because capital-intensive sectors like manufacturing, telecom, and infrastructure usually operate with higher debt levels.
- Investors use the D/E ratio to assess a company’s financial leverage, long-term stability, and overall risk profile.
- The D/E ratio should always be compared with industry peers and analysed alongside other financial ratios such as interest coverage ratio, solvency ratio, and liquidity ratios.
- While a high D/E ratio can increase financial risk, it may also support business expansion if the company generates strong profits and manages debt efficiently.
What is Debt-To-Equity Ratio?
The debt-to-equity ratio measures how much a company uses debt compared to equity to finance its operations. Investors and analysts use this ratio to assess a company’s financial health. When a company earns more from borrowed funds than it spends on debt, its share prices increase. However, rising debt costs reduce profitability and negatively impact the stock. Long-term debts and assets influence the D/E ratio more than short-term ones.
A higher debt-to-equity ratio indicates the company relies heavily on debt, which can pose risks. Lower ratios suggest the company maintains a more balanced and stable approach to financing. Stock market participants negatively identify companies with a high Debt-to-equity ratio.
Calculation of Debt-To-Equity Ratio with Formula And Example
The debt-to-equity ratio is a straightforward financial ratio to calculate total liabilities against the shareholders’ equity. Here, liabilities are both long-term and short-term liabilities.
Formula to Calculate D/E Ratio:
D/E Ratio = [Total Liabilities/ Shareholders’ Equity]
Debt to equity ratio example:
Both liabilities and shareholders’ equity are found in the company’s balance sheet. Given below is the balance sheet of the Nestle company under the financial year of FY 23
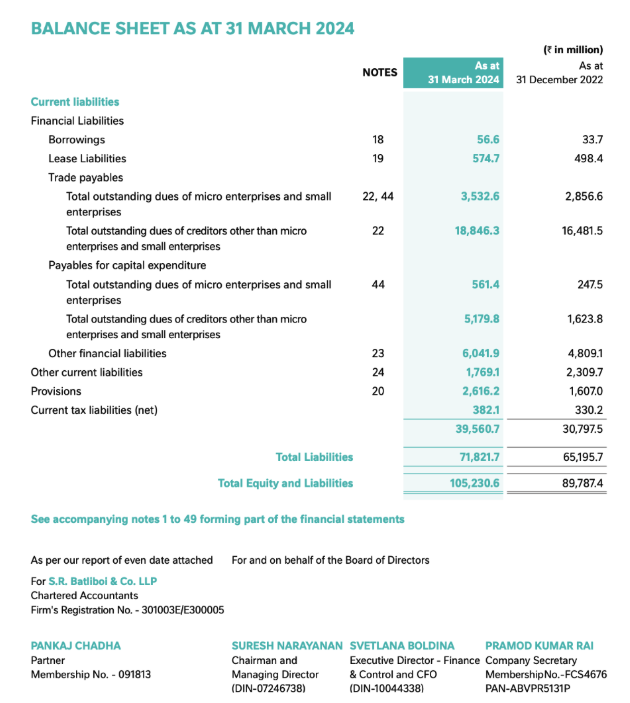
From the balance sheet of Nestle Inc., the total value of liabilities is ₹71,821, and the total shareholders’ equity is ₹33,408. The debt-to-equity ratio for Nestlé Inc. is approximately 2.15. This means the company has ₹2.15 in liabilities for every ₹1 of shareholders’ equity.
Debt to Equity Ratio Interpretation
The Debt-to-Equity (D/E) ratio helps investors understand how a company finances its operations through debt and shareholder equity. The interpretation of the ratio generally depends on the company’s industry, business model, and capital requirements.
Low Debt-to-Equity Ratio
A lower D/E ratio generally indicates that the company relies less on borrowed funds and follows a conservative financing approach. This may reflect lower financial risk and stronger long-term stability.
Moderate Debt-to-Equity Ratio
A balanced D/E ratio often suggests that the company effectively uses debt to support growth while maintaining manageable financial risk.
High Debt-to-Equity Ratio
A higher D/E ratio indicates that the company depends heavily on debt financing. While this may help accelerate business expansion, excessive debt can increase interest obligations and financial risk during economic downturns.
Investors usually compare D/E ratios with industry averages to assess whether the company’s debt levels are reasonable.
How to do the debt-to-equity ratio analysis?
Investors analyse the Debt-to-Equity ratio to evaluate a company’s financial leverage, risk profile, and long-term financial stability. Here are some common approaches used in D/E ratio analysis:
Compare with Industry Peers
The D/E ratio should always be compared with companies operating in the same industry because debt requirements vary significantly across sectors.
Analyse Historical Trends
A consistently rising D/E ratio may indicate increasing financial leverage, while stable or declining ratios may reflect stronger debt management.
Evaluate Interest Coverage
Investors often combine the D/E ratio with the Interest coverage ratio to assess whether the company can comfortably service its debt obligations.
Assess Growth and Profitability
A higher D/E ratio may still be acceptable if the company generates strong profits and stable cash flows that support debt repayment.
Consider Economic Conditions
During periods of rising interest rates or economic uncertainty, companies with excessive debt may face higher financial pressure and refinancing risks.
What is an ideal Debt-to-Equity Ratio?
The ideal debt-to-equity ratio is generally less than or equal to 1. However, some companies, especially capital-intensive ones like manufacturing firms, tend to have higher ratios. For example, in India, companies like Tata Steel Ltd and Adani Power Ltd often have higher debt-to-equity ratios due to their significant capital requirements. Here is a table showing the average debt-to-equity ratio in each sector
|
Sector |
Average Debt-to-Equity Ratio |
Remarks |
|---|---|---|
|
Banking |
Above 1.5 |
High ratio due to reliance on debt for capital growth |
|
Utilities |
>1.2 |
Requires heavy investment in infrastructure |
|
Telecom Services |
>0.8 |
Large capital expenditures for network expansion |
|
Healthcare |
Around 0.7 |
Reflects a more conservative financing structure |
|
Real Estate |
Up to 1.9 (REITs) |
High leveraging for property acquisitions |
Limitations of Debt-to-Equity Ratio
While the Debt-to-equity ratio is widely used to assess a company’s financial health and leverage, it also has certain limitations that investors should consider before making decisions.
Industry-Specific Nature
The Debt-to-Equity ratio varies significantly across industries because different sectors operate with different capital structures and financing requirements. Capital-intensive industries such as manufacturing, infrastructure, and utilities generally maintain higher D/E ratios due to substantial investments in machinery, plants, and infrastructure.
For example, companies such as Tata Steel Ltd. and JSW Steel often operate with higher debt levels to support expansion and operational needs.
In contrast, technology-based companies such as Infosys Ltd. and Tata Consultancy Services usually maintain lower D/E ratios because they follow asset-light business models and rely more on equity and internal cash flows.
Differences in Debt Classification
The definition of debt can vary depending on accounting practices and company structures. In some cases, instruments such as preferred shares may be treated as equity rather than debt because dividend payments on preferred stock are not legally mandatory like interest payments on loans.
This variation can influence the accuracy and comparability of the Debt-to-Equity ratio across companies and industries. The impact is especially noticeable in sectors such as REITs and financial services, where capital structures can be more complex.
Conclusion
The Debt-to-Equity (D/E) ratio is one of the most important financial ratios used to evaluate a company’s financial leverage and long-term stability. It helps investors understand how much a company depends on borrowed funds compared to shareholders’ equity to finance its operations and growth.
A balanced D/E ratio generally reflects healthy financial management, while excessively high debt levels may increase financial risk and pressure on profitability during economic downturns. However, the ideal ratio varies across industries due to differences in business models, operational requirements, and capital intensity.
Investors should analyse the Debt-to-Equity ratio alongside other financial metrics such as solvency ratios, interest coverage ratio, liquidity ratios, and profitability indicators to gain a more comprehensive understanding of a company’s financial health. By combining these insights, investors can make more informed decisions while assessing risk, stability, and long-term growth potential in the stock market.
Frequently Asked Questions (FAQs)
What Does a Negative Debt-to-Equity Ratio Indicate?
The debt-to-equity ratio is calculated from the liabilities of the companies. If the debt-to-equity ratio is negative means the company’s liabilities are more than its shareholders’ equity. This situation indicates that the company has more debt than the total value of assets owned by shareholders.
Is a low debt-to-equity ratio good?
A low debt-to-equity ratio indicates that the company is having conservative financial management, where it is not relying much on borrowing funds to fund its day-to-day operations, which is a positive sign for the investors.
Why ideal debt equity ratio 2:1?
An ideal Debt-to-Equity (D/E) ratio of 2:1 means that for every ₹100 of shareholders’ equity, the company has ₹200 in debt. This suggests the company is using twice as much borrowed money as its own funds to finance its assets. It is considered balanced because the company structure is balanced.
What Does a D/E Ratio of 1.5 Indicate?
A Debt-to-Equity ratio of 1.5 means the company has ₹1.50 in debt for every ₹1 of shareholders’ equity. This indicates that the company relies more on borrowed funds than owner capital to finance its operations and growth.
Whether this ratio is considered healthy depends on the industry. Capital-intensive sectors such as infrastructure, telecom, utilities, and manufacturing often operate with higher D/E ratios, while technology or service-based companies generally maintain lower debt levels.
what does a negative debt to equity ratio mean?
A negative Debt-to-Equity ratio usually occurs when a company’s liabilities exceed its total assets, resulting in negative shareholders’ equity. This may indicate financial stress, accumulated losses, or excessive debt levels.
Companies with negative equity may face challenges in raising capital, servicing debt, or sustaining long-term operations. Investors generally view consistently negative D/E ratios as a warning sign of financial instability.
What Industries Have High D/E Ratios?
Industries that require significant capital investment generally operate with higher Debt-to-Equity ratios because they depend heavily on borrowing to finance infrastructure, expansion, and operational assets.
Examples include:
- Infrastructure
- Utilities
- Telecom
- Real Estate
- Manufacturing
- Energy and Power
For example, companies such as Tata Steel Ltd. and Adani Power Ltd. often maintain higher D/E ratios due to substantial capital expenditure requirements.
How Can the D/E Ratio Be Used to Measure a Company’s Riskiness?
The Debt-to-Equity ratio is widely used to assess a company’s financial risk because it reflects the balance between debt financing and shareholder funding.
A high D/E ratio generally indicates higher financial leverage, meaning the company may face greater pressure to repay debt and interest obligations during periods of weak earnings or economic slowdown.
On the other hand, a lower D/E ratio may indicate stronger financial stability and lower dependence on external borrowing. Investors often analyse the D/E ratio alongside profitability ratios, liquidity ratios, and cash-flow metrics to evaluate overall financial risk.
Disclaimer: This content is for educational purposes only and does not constitute financial or investment advice. Investments in securities or other financial instruments are subject to market risk, including partial or total loss of capital. Past performance is not indicative of future results. Always consider your financial situation carefully and consult a licensed financial advisor before making investment or trading decisions.
Table of Content
Engineered for the obsessed. Built for traders.

Purpose-built terminals.
Zero compromise.
Built for speed.
Plot No 1290, 2nd Floor, 17th Cross, 5th Main, Sector-7, HSR Layout, Bangalore 560102
Follow us on
Mintcap Brokers Private Limited
CIN – U66110KA2023PTC178706 | Registered Address: Plot No 1290, Second Floor, 17th Cross, 5th Main, Sector-7, HSR Layout, Bangalore 560102 | Tel: 080 – 49552310 | Email ID: compliance@capmint.com | SEBI registered Stock Broker: INZ000322732 | NSE Cash/F&O Member ID: 90430 | BSE Cash/F&O Member ID: 6903 | MCX Member ID: 57400 | NCDEX Member ID: 1312 | SEBI registered Depository Participant: IN-DP-806-2025 | CDSL DP ID: 12102300 | NSE Clearing Member code: M70108 | AMFI-Registered Mutual Fund Distributor: ARN-289109 (Valid upto 28-Feb-2027) | Category II Execution Only Platform : E6903
Details of Client Bank Account
Compliance Officer: Ms. Shridevi Vungarala | Email ID: compliance@capmint.com | Tel no. + 91 9035330126 | Grievance Redressal Officer (GRO) – Ms. Shikha Gupta | Email ID: Grievance@capmint.com | Tel no: 9035331595.
Procedure to file a complaint on SEBI SCORES: Register on SCORES portal. Mandatory details for filing complaints on SCORES: Name, PAN, Address, Mobile Number, E-mail ID. Benefits: Effective Communication, Speedy redressal of the grievances. You may refer the website https://scores.sebi.gov.in/ for more information. You may also download the SEBI Scores app to log a complaint Android: https://play.google.com > store > apps > sebiscores iOS: https://apps.apple.com > app > sebiscores
Disclaimer
Investment in the securities market are subject to market risks, read all the related documents carefully before investing. Brokerage will not exceed the SEBI prescribed limit.
Mutual fund investments are subject to market risks, read all scheme related documents carefully before investing. Mutual Funds are not exchange-traded products.
Attention Investor:
- Stock Brokers can accept securities as margin from clients only by way of pledge in the depository system w.e.f. September 1, 2020.
- Update your mobile number & email Id with your stock broker/depository participant and receive OTP directly from depository on your email id and/or mobile number to create pledge.
- Pay 20% as upfront margin of the transaction value to trade in cash market segment.
- Investors may please refer to the Exchange’s Frequently Asked Questions (FAQs) issued vide circular reference NSE/INSP/45191 dated July 31, 2020 and NSE/INSP/45534 dated August 31, 2020 and other guidelines issued from time to time in this regard.
- Check your Securities /MF/ Bonds in the consolidated account statement issued by NSDL/CDSL every month.