
Table of Content
- Key Takeaways
- What Is an Income Statement?
- What Are The Components Of an Income Statement?
- How To Read an Income Statement?
- How to Analyse an Income Statement for Investment Decisions?
- Example of Analysing an Income Statement
- Income Statement vs. Other Financial Statements
- Understanding the Impact of Non-Operating Items on Income
- Conclusion
- Frequently Asked Questions (FAQs)
Link copied!
Income Statement
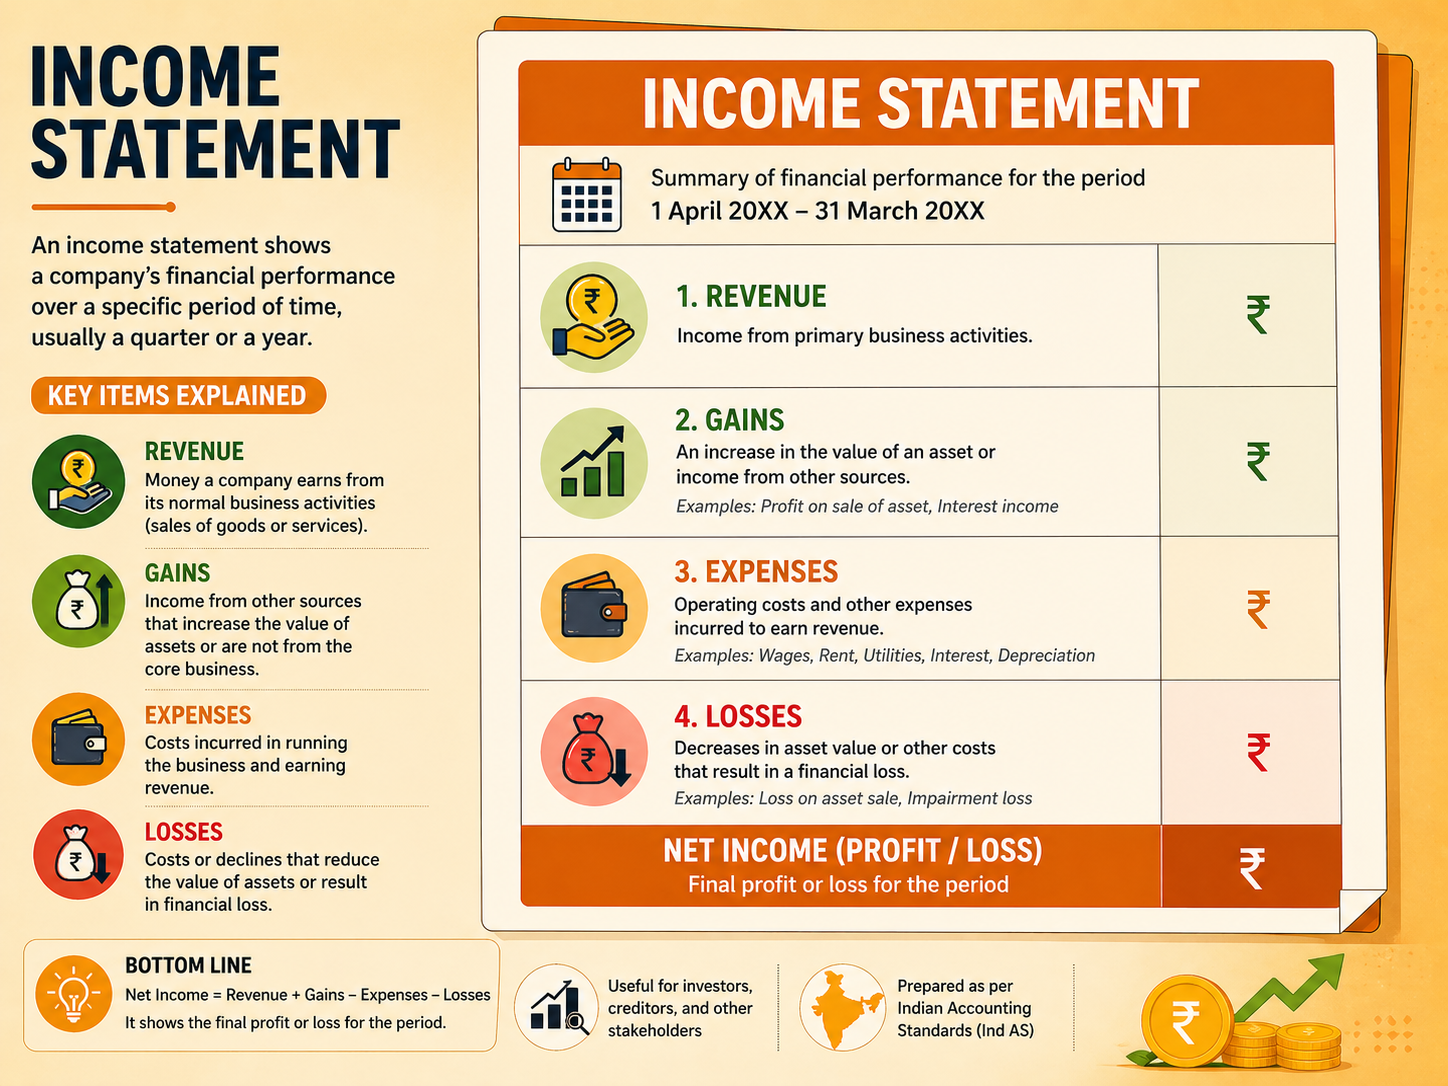
The income statement provides a summary of a company’s revenues, expenses, gains, and losses over a specific period. The income statement is a crucial tool for assessing a company’s profitability and operational efficiency.
Key Takeaways
- Consistent growth in revenue indicates expanding customer demand and increasing market reach.
- Rising gross profit and EBIT alongside revenue reflect better cost efficiency and a strong core business.
- Accelerating growth in net profit highlights true earnings potential and increases investor appeal.
What Is an Income Statement?
The income statement, also known as the profit and loss statement, summarises a company’s revenues and expenses. Its core components include revenue, cost of goods sold, and gross profit. It enables comparisons with industry peers and helps evaluate financial trends over time.
Stock market participants often focus on the top line, representing revenue generated from sales, and the bottom line, which is the net income after all tax deductions. The income statement provides valuable insights into a company’s financial health, supporting management and investors in strategic planning and investment decisions.
What Are The Components Of an Income Statement?
Each section of the income statement format provides unique information about the income statement and offers a unique insight into different aspects of the company’s financial health, operational efficiency, and strategic management. Here’s an overview of its main components, broken down into specific categories and their implications:
Revenue
Revenue, often referred to as the “top line,” represents the total income a company generates from its core business operations, including the sale of goods and services, after accounting for returns, allowances, and discounts. It may also encompass ancillary revenues such as interest income, rental income, or gains from non-core activities.
This snapshot from Suzlon’s income statement shows how the company reports its revenue. The majority comes from Revenue from operations, which represents Suzlon’s core business of providing renewable energy solutions worldwide. Additional categories include Other operating income (non-core operational earnings) and Other income (earnings not related to operations). Together, these make up the company’s Total Income for the reporting period.
Cost of Goods Sold (COGS)
Money spent on producing goods or delivering services during a specific period includes key components such as raw materials and direct labour costs, which cover the wages of workers directly involved in production.
Gross Profit
Gross profit is calculated by adjusting the revenue and cost of goods sold. Indicates the profitability of core operations before factoring in indirect expenses. A higher gross profit indicates effective production management, better supplier negotiations, or streamlined manufacturing processes.
Expenses
Expenses encompass all costs incurred to operate a business, whether directly related to production or not. They are classified into two types: operating expenses, such as office rent and administrative staff salaries, and non-operating expenses, which are costs unrelated to core business activities.
The above example highlights operating and non-operating expenses in Suzlon’s financials. Major expenses include raw materials, components consumed, and services rendered, reflecting the core costs of running the business.
EBIT
Earnings before interest and taxes, also known as operating profit or operating income, measure a company’s profitability from core operations before accounting for interest and taxes. They reflect the efficiency of a company in generating profits from its primary activities.
Net Income
Often referred to as the bottom line of the income statement, net income reflects a company’s profitability by integrating operational, financial, and tax-related outcomes. Earnings Per Share (EPS), derived from net income, is a key metric for investment decisions, providing insight into a company’s earnings and profitability per share. While net income alone cannot fully assess performance, analysing it alongside other metrics offers a comprehensive view of the company’s financial health and efficiency.
How To Read an Income Statement?
An income statement balance sheet provide an overview of a company’s financial performance. Analysts and stock market participants use this information to make informed decisions about the business’s profitability and potential. Here is a step-by-step guide to reading an income statement to gain valuable insights:
Revenue
This reflects the company’s sales and services performance. Ideally, these should show steady growth, as consistent revenue indicates expanding customer demand and an increase in market reach.
Cost of Goods Sold (COGS)
Ideally, this should increase with revenue, but the key is to keep it low relative to revenue growth.
Gross Profit
Profits should increase along with revenue, as this improvement reflects better cost efficiency in production and indicates a strong core business.
EBIT
Operating profit should increase alongside revenue and gross profit, reflecting a profitable core operation. This trend is a positive indication that the company’s primary business is becoming more efficient.
Net Profit
This is the total profit after all expenses are deducted. It should ideally grow at an accelerating pace, as this is crucial for assessing the company’s true earnings potential and appeal to investors.
How to Analyse an Income Statement for Investment Decisions?
An income statement shows a company’s revenues, expenses, and profits over a specific period. Here’s a practical approach to analysing it for smarter investment decisions:
Start with Revenue
Check if revenue is growing steadily. Consistent growth indicates strong market demand and business expansion.
Examine Gross Profit and Margin
Gross Margin (%) = (Gross Profit ÷ Revenue) × 100.
A stable or improving margin suggests efficient production or strong pricing power.
Review Operating Expenses
Compare operating expenses as a percentage of revenue over time. Rising expenses may signal inefficiency, while stable ratios suggest good cost control.
Check Operating and Net Profit
Positive and growing Operating Income (EBIT) and Net Profit indicate strong business performance. Watch out for declining profitability despite stable revenue.
Spot Non-Recurring Items
Ignore one-time gains or losses to focus on the company’s sustainable earnings.
Compare with Industry Peers
Benchmark key metrics against competitors to assess relative strength and market position.
Track Trends Over Time
Review at least 3–5 years of data to identify consistent patterns in growth and profitability.
Example of Analysing an Income Statement
Let’s understand how an income statement works using the consolidated profit and loss statement of Reliance Industries Ltd.

For the financial year ending March 2025, Reliance Industries Ltd. reported Net Sales of ₹9,64,693 crore, compared to ₹9,01,064 crore in March 2024. This increase in revenue indicates steady business growth and strong demand across its business segments.
The company’s Operating Expenses stood at ₹7,99,438 crore, which includes costs related to production, operations, employee expenses, and other business activities. After deducting these expenses from revenue, Reliance Industries Ltd. generated an Operating Profit of ₹1,65,255 crore, reflecting strong operational performance.
Reliance Industries Ltd. also reported Other Income of ₹18,167 crore, which may include interest income, investments, and non-core business earnings.
One of the key profitability indicators, EBITDA, increased to ₹1,83,422 crore in March 2025 from ₹1,78,290 crore in the previous year. This growth suggests that the company improved its earnings from core operations before accounting for interest, taxes, depreciation, and amortisation.
After adjusting for taxes and other expenses, the company reported a Profit After Tax (PAT) of ₹80,787 crore, slightly higher than ₹78,633 crore in March 2024. This consistent rise in profit highlights stable financial performance.
The company also recorded an Earnings Per Share (EPS) of ₹51.47, helping investors understand the profit generated for each outstanding share. Additionally, the Net Profit Margin stood at 7.54%, showing the company’s ability to convert revenue into net profit efficiently.
This example demonstrates how an income statement helps investors analyse revenue growth, profitability, operational efficiency, and overall financial health across multiple financial years.
Income Statement vs. Other Financial Statements
The Income Statement is one of the three main financial statements, alongside the Balance Sheet and the Cash Flow Statement. While each provides valuable insights, their focus is different:
Income Statement
Shows a company’s revenues, expenses, and net profit (or loss) over a specific period. It highlights profitability and operating performance.
Balance Sheet
Presents the company’s assets, liabilities, and equity at a specific point in time. It reflects financial position and stability.
Cash Flow Statement
Tracks cash inflows and outflows from operations, investing, and financing activities. It shows how cash is generated and used.
The income statement focuses on profitability over time, while the balance sheet and cash flow statement focus on financial health and liquidity at a given point or period.
Understanding the Impact of Non-Operating Items on Income
Non-operating items on an income statement include revenues and expenses that are not related to a company’s core business operations, such as interest income, interest expenses, gains or losses from the sale of assets, or one-time charges. These items can significantly impact the overall net income, either boosting it when there is a gain or reducing it when there are unexpected expenses.
While they don’t reflect the company’s main business performance, understanding non-operating items is important because they can distort the true picture of ongoing profitability, making it essential for investors and management to analyse them separately from operating results.
Conclusion
The income statement is a vital tool for understanding a company’s financial performance. By analysing its key components, revenue, cost of goods sold, gross profit, operating expenses, EBIT, and net income, you gain insights into the company’s profitability, operational efficiency, and overall financial health. Revenue shows how well the business generates sales, while COGS and gross profit highlight cost control and production efficiency. EBIT reflects the company’s ability to manage its operations profitably, and net income gives the final picture of its earnings after all expenses and taxes.
For investors and analysts, trends in these metrics are crucial for making informed decisions. Growing revenue, controlled costs, and improving profits indicate a strong business. Tools like EPS provide further clarity for investment choices. Overall, the income statement enables firms and stakeholders to assess performance, plan strategies, and make sound financial and investment decisions.
Frequently Asked Questions (FAQs)
What is a formula income statement?
A formula income statement is a simple way to calculate profit using this formula:
Net Income = Revenue + Gains – Losses – Expenses.
It helps you quickly see how much money a business made by subtracting total expenses from total revenue.
How do I prepare an income statement?
To prepare an income statement:
- List the total Revenue earned.
- Subtract Cost of Goods Sold (COGS) to get Gross Profit.
- Subtract Operating Expenses (like rent, salaries, and utilities) to get Operating Income.
- Add or subtract any other income or expenses (such as interest).
- Subtract Taxes to get the final Net Income (profit or loss).
What is another name for the income statement?
The income statement is also called the Profit and Loss Statement (P&L). Other names include Statement of Earnings or Statement of Operations. All these refer to the same report that shows how much a business earned and spent over time.
Disclaimer: This content is for educational purposes only and does not constitute financial or investment advice. Investments in securities or other financial instruments are subject to market risk, including partial or total loss of capital. Past performance is not indicative of future results. Always consider your financial situation carefully and consult a licensed financial advisor before making investment or trading decisions.
Table of Content
- Key Takeaways
- What Is an Income Statement?
- What Are The Components Of an Income Statement?
- How To Read an Income Statement?
- How to Analyse an Income Statement for Investment Decisions?
- Example of Analysing an Income Statement
- Income Statement vs. Other Financial Statements
- Understanding the Impact of Non-Operating Items on Income
- Conclusion
- Frequently Asked Questions (FAQs)
Engineered for the obsessed. Built for traders.

Purpose-built terminals.
Zero compromise.
Built for speed.
Plot No 1290, 2nd Floor, 17th Cross, 5th Main, Sector-7, HSR Layout, Bangalore 560102
Follow us on
Mintcap Brokers Private Limited
CIN – U66110KA2023PTC178706 | Registered Address: Plot No 1290, Second Floor, 17th Cross, 5th Main, Sector-7, HSR Layout, Bangalore 560102 | Tel: 080 – 49552310 | Email ID: compliance@capmint.com | SEBI registered Stock Broker: INZ000322732 | NSE Cash/F&O Member ID: 90430 | BSE Cash/F&O Member ID: 6903 | MCX Member ID: 57400 | NCDEX Member ID: 1312 | SEBI registered Depository Participant: IN-DP-806-2025 | CDSL DP ID: 12102300 | NSE Clearing Member code: M70108 | AMFI-Registered Mutual Fund Distributor: ARN-289109 (Valid upto 28-Feb-2027) | Category II Execution Only Platform : E6903
Details of Client Bank Account
Compliance Officer: Ms. Shridevi Vungarala | Email ID: compliance@capmint.com | Tel no. + 91 9035330126 | Grievance Redressal Officer (GRO) – Ms. Shikha Gupta | Email ID: Grievance@capmint.com | Tel no: 9035331595.
Procedure to file a complaint on SEBI SCORES: Register on SCORES portal. Mandatory details for filing complaints on SCORES: Name, PAN, Address, Mobile Number, E-mail ID. Benefits: Effective Communication, Speedy redressal of the grievances. You may refer the website https://scores.sebi.gov.in/ for more information. You may also download the SEBI Scores app to log a complaint Android: https://play.google.com > store > apps > sebiscores iOS: https://apps.apple.com > app > sebiscores
Disclaimer
Investment in the securities market are subject to market risks, read all the related documents carefully before investing. Brokerage will not exceed the SEBI prescribed limit.
Mutual fund investments are subject to market risks, read all scheme related documents carefully before investing. Mutual Funds are not exchange-traded products.
Attention Investor:
- Stock Brokers can accept securities as margin from clients only by way of pledge in the depository system w.e.f. September 1, 2020.
- Update your mobile number & email Id with your stock broker/depository participant and receive OTP directly from depository on your email id and/or mobile number to create pledge.
- Pay 20% as upfront margin of the transaction value to trade in cash market segment.
- Investors may please refer to the Exchange’s Frequently Asked Questions (FAQs) issued vide circular reference NSE/INSP/45191 dated July 31, 2020 and NSE/INSP/45534 dated August 31, 2020 and other guidelines issued from time to time in this regard.
- Check your Securities /MF/ Bonds in the consolidated account statement issued by NSDL/CDSL every month.