
Link copied!
Interest Spread
Interest Spread is the difference between the average lending rate (the rate a bank charges on loans) and the average deposit rate (the rate it pays on deposits). It measures a bank’s core profitability from its lending and deposit-taking activities.
Key Takeaways
- Interest Spread Defined: It is the difference between the average lending rate and the average deposit rate, directly impacting a bank’s net interest income and profitability.
- Profitability & Risk Indicator: A higher spread usually means better profitability, but an excessively high spread may indicate riskier lending practices.
- Factors Affecting Spread: Credit risk management, CASA ratio, market competition, and macroeconomic conditions all play a role in determining a bank’s interest spread.
- Investor Perspective: Tracking interest spread trends helps investors assess a bank’s financial health, resilience in economic downturns, and potential for long-term growth.
What is Interest Spread?
Loan-granting institutions, such as commercial banks, generate interest income from various sources. Deposits are a primary funding source, typically in the form of current and savings accounts or fixed deposits (FDs), obtained at low interest rates. These institutions then deploy these funds by issuing various types of loans, such as mortgages, home equity loans, student loans, car loans, and credit card lending at higher interest rates. This difference between the rate banks charge borrowers and the rate they pay depositors is known as the interest spread.
For investors, understanding the interest spread is crucial, as it directly impacts a bank’s net interest income (NII) and overall profitability. A widening spread often signals strong earnings potential, while a narrowing spread may indicate competitive pressures or unfavourable economic conditions. Tracking how a bank’s spread moves across two or three rate cycles tends to reveal far more about its pricing discipline than a single quarter’s snapshot.
How to Calculate Interest Rate Spread?
Net Interest Spread Formula:
Interest Spread = Average Lending Rate − Average Deposit Rate
For example, if a bank lends at an average rate of 10% per year while paying depositors an average of 4%, the interest rate spread is 6%. The greater the spread, the higher the potential for interest income.
Let’s take this further with a real-life example of HDFC Bank.
Now we will break down the original interest spread ratio formula and learn the step-by-step calculation of the interest spread.
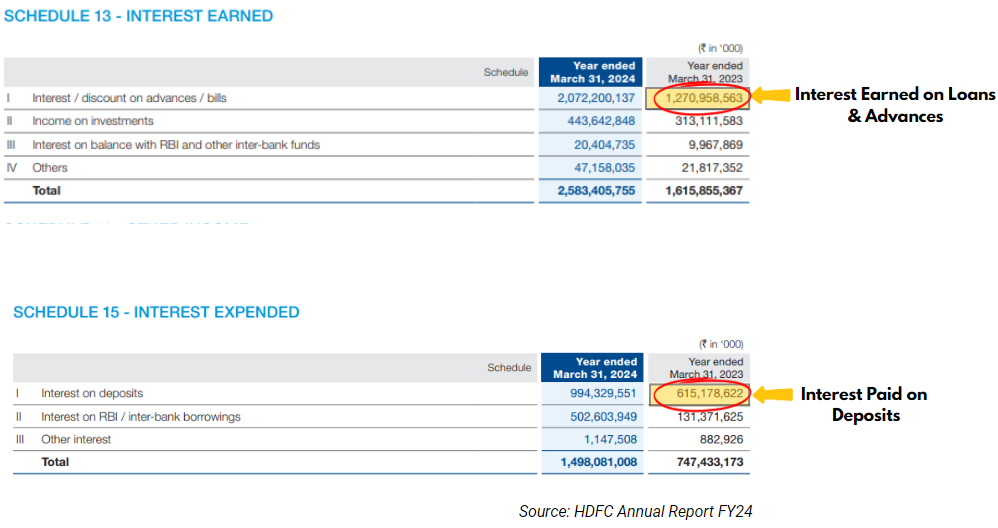
Step 1: Calculate Average Lending Rate
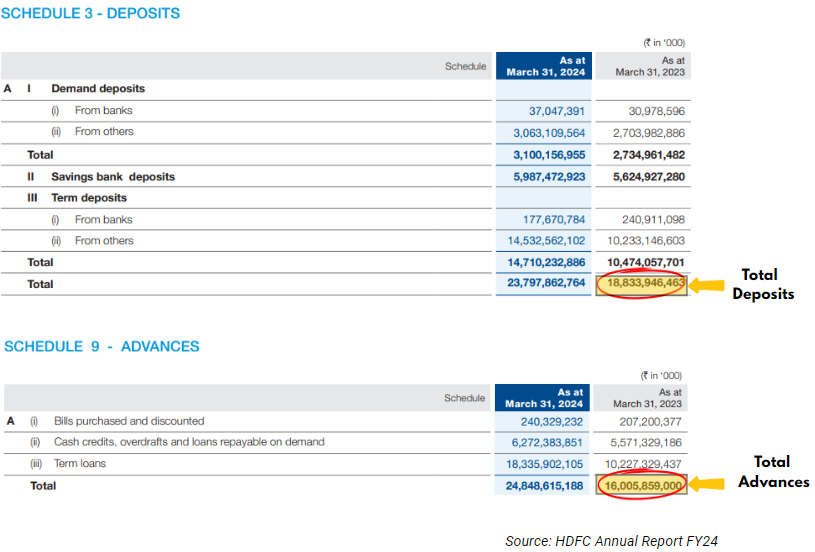
Average Lending Rate = Interest Earned on Advances / Total Advances × 100
Which turns out to be 7.49% (after putting in the numbers in the image)
Step 2: Calculate Average Deposit Rate
Average Deposit Rate = Interest Paid on Deposits / Total Deposits × 100
Which turns out to be 3.27% (after putting in the numbers in the image)
Step 3: Calculate Interest Spread
Interest Spread = Average Lending Rate − Average Deposit Rate
Putting in the above calculated numbers, we get,
Interest Spread as 4.22% (7.49% − 3.27%)
Differences & Connections: Spread vs NIM vs NII
When analysing banks, investors often come across three closely related terms: interest spread, net interest income (NII), and net interest margin (NIM). At first glance, they can seem like the same thing, but they are not. Each one measures a different piece of the puzzle, and together they give a much clearer picture of how well a bank is actually making money.
Interest Spread
Think of interest spread as the simplest of the three. It just asks one question: how much more is the bank charging borrowers compared to what it’s paying depositors?
Formula: Interest Spread = Average Lending Rate − Average Deposit Rate
For example, if a bank lends money at an average rate of 10% and pays depositors an average of 4%, the interest spread is 6%.
This is a rate-only metric; it doesn’t account for the actual size of the bank or how many loans it has given out. It purely captures the pricing gap between borrowing and lending. A wider spread generally means the bank has more room to earn, while a narrowing spread can be an early warning sign that margins are getting squeezed. In practice, a spread that narrows by even 20–30 basis points over consecutive quarters often precedes a visible dip in reported earnings.
Net Interest Income (NII)
While interest spread tells you about rates, NII tells you about real money. It’s the actual rupee (or dollar) profit a bank makes from its core lending business, after paying out interest to depositors and other lenders.
Formula: NII = Interest Earned − Interest Paid
For example, if a bank collects ₹10,000 crore in interest from all its loans and pays out ₹6,000 crore in interest on deposits and borrowings, its NII is ₹4,000 crore.
NII is essentially the top line of a bank’s income from its core business, the equivalent of revenue for a regular company. It grows when the bank gives out more loans, when interest rates move in its favour, or when it manages to keep its cost of deposits low. This is why investors watch NII closely; a consistently growing NII usually signals that a bank’s core business is healthy and expanding.
Net Interest Margin (NIM)
NII tells you the absolute profit, but it doesn’t tell you how efficiently the bank is generating that profit relative to its size. That’s exactly what NIM does.
Formula: NIM = (Net Interest Income / Average Interest-Earning Assets) × 100
Interest-earning assets include loans, investments in bonds, and other assets that generate interest income for the bank.
Let’s say Bank A has an NII of ₹4,000 crore, and Bank B also has an NII of ₹4,000 crore. Looks identical, right? But if Bank A achieved this with ₹80,000 crore in assets while Bank B needed ₹1,20,000 crore, then Bank A is clearly more efficient. NIM captures exactly this difference. It converts NII into a percentage so you can compare banks of vastly different sizes on an equal footing.
A higher NIM generally indicates that a bank is deploying its assets more profitably.
How Do They All Fit Together?
These three metrics aren’t independent. They flow naturally from one to the next, each building on the previous one.
It starts with the interest spread, which reflects how favourably a bank has priced its loans versus its deposits. This pricing gap sets the foundation for how much interest income the bank can generate. That income, once interest expenses are subtracted, becomes the NII, the bank’s actual earnings from lending in absolute terms. Finally, when you take that NII and divide it by the bank’s interest-earning assets, you get the NIM, a cleaner, size-adjusted measure of how efficiently the bank is turning its assets into profit.
A common mistake when analysing banks is looking at only one of these metrics in isolation. A bank may show a healthy spread, for instance, but if its loan book hasn’t grown, its NII may still disappoint. All three need to move in the same direction to confirm genuine improvement.
Why is Interest Spread Important for Investors?
1. Profitability Indicator
Net interest spread for banks is a primary driver of a bank’s net interest margin (NIM), which represents net interest income as a percentage of earning assets. A higher spread translates into stronger margins and improved earnings for shareholders.
2. Risk and Stability Assessment
Banks with consistently strong interest spreads are typically more resilient in economic downturns, as they have better pricing power. However, an excessively high spread may signal higher credit risk, meaning the bank is lending to riskier borrowers at elevated rates, which the borrower might not be able to repay. This pattern has been visible in certain Indian microfinance-focused lenders, where spreads above 10–12% often coincided with elevated NPA ratios within 12 to 18 months.
3. Economic Sensitivity
Net interest spread trends can indicate broader economic shifts. For instance, a declining spread may reflect low interest rate environments, increased competition, or central bank interventions, all of which may pressure profitability.
Key Factors Affecting Interest Spread
Several macroeconomic and institution-specific factors influence a bank’s interest spread. These factors determine how efficiently a bank can generate profits from its lending operations while managing risks.
Bank-Specific Factors
Credit risk management is a crucial factor. Banks that extend loans to high-risk borrowers often charge higher interest rates to compensate for the increased probability of defaults. While this strategy can initially lead to higher spreads, excessive risk-taking may backfire if default rates rise significantly, leading to financial instability and lower overall returns. Prudent credit risk assessment helps banks maintain a balanced spread without exposing themselves to unnecessary risks.
Another key factor is the CASA (Current Account Savings Account) ratio, which significantly impacts a bank’s cost of funds and, in turn, its interest spread. Banks with a higher CASA ratio rely more on low-cost deposits, such as current and savings accounts, where interest rates are minimal or even zero. This helps keep the bank’s overall funding costs low, allowing it to maintain a wider interest spread. Conversely, banks with a lower CASA ratio depend more on costly funding sources like fixed deposits or market borrowings, which can increase funding costs and narrow the interest spread, ultimately pressuring profitability. For context, among large Indian private banks, CASA ratios typically range between 38% and 48%, and even a 4–5 percentage point difference within this range can noticeably affect spread stability across rate cycles. Each bank’s individual financial health and operational efficiency also impact interest spreads.
Competitive Market Conditions
Market competition significantly affects interest spreads. In highly competitive banking sectors, institutions are often forced to narrow their spreads to attract borrowers. When multiple banks compete for the same customers, they may lower lending rates or offer higher deposit rates, reducing their overall interest spread.
Macroeconomic Factors
Macroeconomic conditions play a crucial role in shaping interest spreads. One of the most significant factors is inflation rates. When inflation rises, central banks often respond by increasing benchmark interest rates, leading to a wider spread initially, as banks usually raise lending rates faster than deposit rates.
Another critical macroeconomic factor is monetary policy. Central banks influence interest spreads by adjusting policy rates. For instance, when the central bank lowers the interest rate and deposit rates adjust more slowly than lending rates, the spread may widen initially. This asymmetry in transmission speed is worth watching closely; during the RBI’s rate cut cycles, the lag between lending rate adjustments and deposit rate repricing has historically stretched anywhere from one to three quarters.
Conclusion
Interest spread is a crucial metric that reflects a bank’s core profitability, risk management, and sensitivity to economic conditions. A higher spread indicates strong earnings potential, while a narrowing spread can suggest increased competition or economic headwinds. Investors should analyse a bank’s interest spread in conjunction with other financial indicators to assess its stability and growth prospects. Understanding the factors influencing interest spread, such as credit risk, CASA ratio, market competition, and macroeconomic trends, can provide deeper insights into a bank’s financial health and investment potential.
Frequently Asked Questions (FAQs)
What does the interest spread mean?
Interest spread refers to the difference between the interest rate a financial institution charges on loans and the interest rate it pays on deposits. This metric is crucial for assessing a bank’s profitability.
How is interest spread calculated?
Interest spread is calculated by subtracting the average interest rate paid on deposits from the average interest rate earned on loans.
Why is interest spread important for banks?
Interest spread is a key determinant of a bank’s profitability. A larger spread indicates that the bank is earning more from its lending activities relative to what it pays on deposits, contributing to higher net interest income.
What factors influence interest spreads?
Several factors can influence interest spreads, including monetary policy, market competition, credit risk, and the overall economic environment. Changes in these factors can affect both the interest rates banks charge on loans and the rates they offer on deposits.
How does interest spread differ from net interest margin?
While interest spread focuses on the difference between lending and deposit rates, net interest margin (NIM) measures the difference between the interest income generated and the amount of interest paid out relative to the bank’s interest-earning assets. NIM provides a more comprehensive view of a bank’s profitability because it accounts for the scale at which the bank operates.
What are some interest rate spread examples?
Interest rate spreads appear in many financial situations. Examples include the difference between corporate bond yields and government bond yields, loan interest rates and deposit rates charged by banks, mortgage rates and government bond yields, and high-yield bond returns compared with investment-grade bond yields. These spreads reflect differences in risk, credit quality, and market conditions.
Disclaimer: This content is for educational purposes only and does not constitute financial or investment advice. Investments in securities or other financial instruments are subject to market risk, including partial or total loss of capital. Past performance is not indicative of future results. Always consider your financial situation carefully and consult a licensed financial advisor before making investment or trading decisions.
Engineered for the obsessed. Built for traders.

Purpose-built terminals.
Zero compromise.
Built for speed.
Plot No 1290, 2nd Floor, 17th Cross, 5th Main, Sector-7, HSR Layout, Bangalore 560102
Follow us on
Mintcap Brokers Private Limited
CIN – U66110KA2023PTC178706 | Registered Address: Plot No 1290, Second Floor, 17th Cross, 5th Main, Sector-7, HSR Layout, Bangalore 560102 | Tel: 080 – 49552310 | Email ID: compliance@capmint.com | SEBI registered Stock Broker: INZ000322732 | NSE Cash/F&O Member ID: 90430 | BSE Cash/F&O Member ID: 6903 | MCX Member ID: 57400 | NCDEX Member ID: 1312 | SEBI registered Depository Participant: IN-DP-806-2025 | CDSL DP ID: 12102300 | NSE Clearing Member code: M70108 | AMFI-Registered Mutual Fund Distributor: ARN-289109 (Valid upto 28-Feb-2027) | Category II Execution Only Platform : E6903
Details of Client Bank Account
Compliance Officer: Ms. Shridevi Vungarala | Email ID: compliance@capmint.com | Tel no. + 91 9035330126 | Grievance Redressal Officer (GRO) – Ms. Shikha Gupta | Email ID: Grievance@capmint.com | Tel no: 9035331595.
Procedure to file a complaint on SEBI SCORES: Register on SCORES portal. Mandatory details for filing complaints on SCORES: Name, PAN, Address, Mobile Number, E-mail ID. Benefits: Effective Communication, Speedy redressal of the grievances. You may refer the website https://scores.sebi.gov.in/ for more information. You may also download the SEBI Scores app to log a complaint Android: https://play.google.com > store > apps > sebiscores iOS: https://apps.apple.com > app > sebiscores
Disclaimer
Investment in the securities market are subject to market risks, read all the related documents carefully before investing. Brokerage will not exceed the SEBI prescribed limit.
Mutual fund investments are subject to market risks, read all scheme related documents carefully before investing. Mutual Funds are not exchange-traded products.
Attention Investor:
- Stock Brokers can accept securities as margin from clients only by way of pledge in the depository system w.e.f. September 1, 2020.
- Update your mobile number & email Id with your stock broker/depository participant and receive OTP directly from depository on your email id and/or mobile number to create pledge.
- Pay 20% as upfront margin of the transaction value to trade in cash market segment.
- Investors may please refer to the Exchange’s Frequently Asked Questions (FAQs) issued vide circular reference NSE/INSP/45191 dated July 31, 2020 and NSE/INSP/45534 dated August 31, 2020 and other guidelines issued from time to time in this regard.
- Check your Securities /MF/ Bonds in the consolidated account statement issued by NSDL/CDSL every month.