
Table of Content
- Key Points
- What is a Cash Flow Statement?
- What Are The Components Of a Cash Flow Statement?
- Importance of Cash Flow Statement
- How to Calculate Cash Flow?
- How to Read a Cash Flow Statement?
- Cash Flow Analysis for Investors
- Cash Flow vs. Profitability
- Cash Flow Ratios
- Example of Cash Flow Statement
- What Are The Red Flags In the Cash Flow Statement?
- What are the key differences between accrual accounting and cash accounting?
- How Can a Company Improve Its Cash Flow?
- Conclusion
- Frequently Asked Questions (FAQs)
Link copied!
Cash Flow Statement
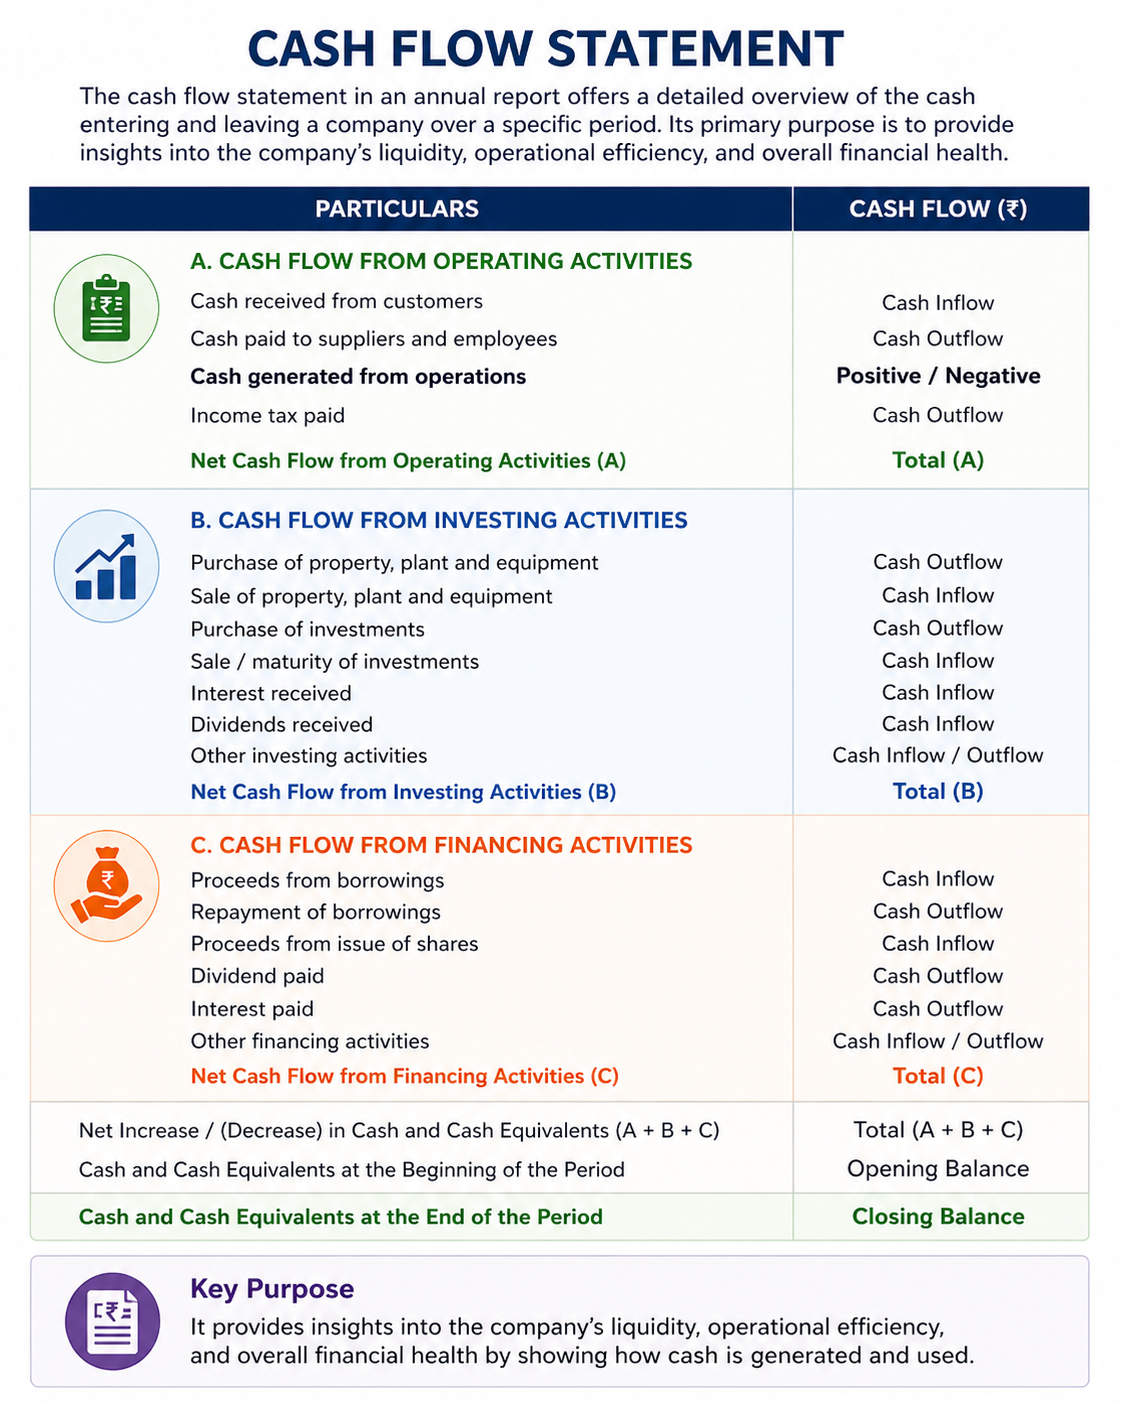
The cash flow statement in an annual report offers a detailed overview of the cash entering and leaving a company over a specific period. Its primary purpose is to provide insights into the company’s liquidity, operational efficiency, and overall financial health.
Key Points
- Cash flow reveals proper financial health by showing actual cash available for operations, debt payments, and growth beyond just profits.
- Cash flow metrics like cash flow to debt, cash flow margin, and FCF yield help assess a company’s liquidity, risk, and growth potential.
- Watch for non-recurring cash inflows and high debt with low cash flow, as these can signal financial instability and limited operational sustainability.
What is a Cash Flow Statement?
The cash flow statement is a key financial document for a company, tracking all cash transactions within a specific period. This statement is divided into three categories: operating, investing, and financing activities.
Operating activities capture all cash transactions related to the company’s day-to-day operations, reflecting the business’s core activities. Investing activities focus on long-term aspects, such as investments in assets or other companies, showing how the business is positioning itself for future growth. Finally, financing activities record transactions related to funding the business, including paying off debts and managing accounts related to capital financing.
What Are The Components Of a Cash Flow Statement?
Each company’s cash flow statement is divided into three main components: operating, investing, and financing activities. While some companies may adjust this structure to their advantage, the core principle remains the same. Here’s a breakdown of each
Operating Activities
The daily activities of the company’s core business typically include product sales, new hiring, and product manufacturing, which collectively reflect the total cash generated from regular operations.
Cash flow from operating activities indicates the company’s operational efficiency by showing how much cash is generated from core operations. A positive cash flow is a good sign, as it reflects strong cash generation. This metric also serves as an indicator of the company’s liquidity and its ability to meet short-term obligations.
Investing Activities
Cash spent on investment activities reflects the company’s long-term strategic focus on investments and asset management. This includes buying or selling physical assets such as property, plant, and equipment (PPE). Cash flow is an outflow when assets are purchased and becomes an inflow when the sale of old or unneeded assets generates cash.
Companies use excess cash from their bank accounts to invest in stocks, bonds, and other financial instruments to generate additional returns. This activity offers insight into the company’s approach to managing its cash surplus effectively.
Financing Activities
This section of the cash flow statement provides information on the company’s capital structure, including equity, debt, and shareholding patterns. When the company issues debt, it generates a cash inflow, and similarly, issuing new shares is recorded as an inflow.
Financing activities in the company reveal its approach to managing capital structure, balancing debt and equity, and controlling risk and cost. Financial strategy shows preferences for debt or equity based on market conditions. Shareholder returns, through dividends and buybacks, reflect value-return strategies and signal management’s growth confidence.
Importance of Cash Flow Statement
A company should maintain sufficient cash to repay its loans, purchase essential commodities, and make investments that drive profitability. If a company cannot meet its loan obligations, it may face bankruptcy. By reviewing a cash flow statement, one can understand the cash available within the company, providing insight into its financial stability and ability to meet these obligations.
How to Calculate Cash Flow?
Two primary methods are used to calculate cash flow: the direct method and the indirect method. Each has a unique approach to assessing cash flow from operating activities.
Direct method
The direct method is more time-consuming because it involves listing all cash receipts and payments and converting them from an accrual basis to a cash basis. This method provides a straightforward view of actual cash inflows and outflows. The formula is here.
Net Cash Flow from Operating Activities=Cash Received from Customers−Cash Paid to Suppliers−Cash Paid for Operating Expenses−Cash Paid for Interest−Cash Paid for Taxes
Indirect Method
The indirect method is more common in the financial industry for calculating cash flow. It begins with net income, adjusting for non-cash transactions (like depreciation and amortisation), and changes in working capital to determine cash flow from operating activities. This method provides an efficient way to reconcile net income with actual cash generated from operations, making it widely used and more accessible to prepare from existing financial statements.
The formula for the Indirect Method is:
Net Cash Flow from Operating Activities = Net Income Non-Cash Expenses − Non-Cash Revenues+Changes in Working Capital.
How to Read a Cash Flow Statement?
A cash flow statement shows how money moves in and out of a business. Instead of profits, it focuses on actual cash, helping you understand whether a company can sustain operations and grow.
1. Start with Operating Activities
This is the most important section. It shows cash generated from core business operations like sales and expenses.
- Positive cash flow → Business is generating real cash
- Negative cash flow → Company may be struggling operationally
2. Check Investing Activities
This section shows how the company is spending or earning from investments.
- Buying assets (machinery, equipment) → Cash outflow
- Selling assets → Cash inflow
3. Analyse Financing Activities
This shows how the company raises or returns money.
- Issuing shares or taking loans → Cash inflow
- Paying dividends or repaying debt → Cash outflow
4. Look at Net Cash Flow
This is the final number after combining all three sections.
- Positive → Cash is increasing
- Negative → Cash reserves are reducing
5. Compare with Profit
A company can show profit but still have low cash flow.
This is why cash flow gives a more realistic picture than profit alone.
Cash Flow Analysis for Investors
To understand a company’s financial performance, analysing cash flow is essential. This can be achieved by examining the company’s free cash flow. Here is the process to explore it:
Assessing Free Cash Flow (FCF)
Free cash flow is the total cash flow after adjusting for capital expenditures (CapEx) by the company. It demonstrates the company’s ability to generate profits and invest in future growth independently, without relying on external financing. This measure reassures investors of the company’s financial strength and its capacity to support long-term growth.
FCF = Operating Cash Flow − Capital Expenditures (CapEx)
FCF reveals actual profit after essential investments, indicating a company’s reinvestment capacity for growth. It’s a crucial valuation metric, reflecting cash available to enhance shareholder value.
Cash Flow vs. Profitability
Cash flow and profitability are both essential indicators of a company’s financial health, but they reflect different aspects of its performance and stability. The critical difference lies in timing: cash flow is recorded when cash is actually received or spent, while net profit is calculated on an accrual basis, meaning it includes revenues earned and expenses incurred, regardless of whether money has changed hands.
Why is cash flow more reliable?
For companies to operate smoothly on a daily basis, they must be able to meet their short-term obligations. Having sufficient cash flow helps cover these immediate expenses. However, while the income statement may show net profit, this profit could include revenue tied up in accounts receivable. In such cases, even if the business is technically profitable, it may still face cash shortages if the cash isn’t readily available to meet current liabilities.
Cash Flow Ratios
The cash flow ratio offers valuable insights into a company’s financial health, particularly in terms of liquidity, risk management, and growth capacity. Here’s a closer look at the key aspects of the cash flow ratio:
Cash Flow to Debt Ratio: [Operating Cash Flow/Total Debt in the company]
Operating cash flow is shown in the operating activities section of the cash flow statement. A higher operating cash flow ratio means the company has enough cash from its primary operations to pay its debts, indicating good financial health.
In contrast, a lower ratio suggests the company could have trouble covering short-term obligations, which could lead to cash flow problems during challenging times.
Cash Flow Margin: [Operating Cash Flow / Net Sales]
Cash flow margin shows how much cash is generated from every dollar of sales. It tells us how efficiently a company turns sales into cash. A high cash flow margin means the company is good at turning sales into actual cash, which is a positive sign of financial health.
A low cash flow margin could mean the company needs to work on generating cash from its sales, which might lead to cash issues, especially if most sales are on credit or if it has high expenses.
Free Cash Flow (FCF) Yield: [Free Cash Flow / Market Capitalization]
Free cash flow (FCF) yield tells investors how much free cash flow a company generates compared to its market value. It helps investors see the cash return they get from an investment in the company. A high FCF yield suggests that the company is generating strong cash flows relative to its value, which can be a sign of a solid investment.
A low FCF yield might indicate weaker cash generation or an overvalued stock, which could be a red flag for investors looking for reliable returns.
Example of Cash Flow Statement
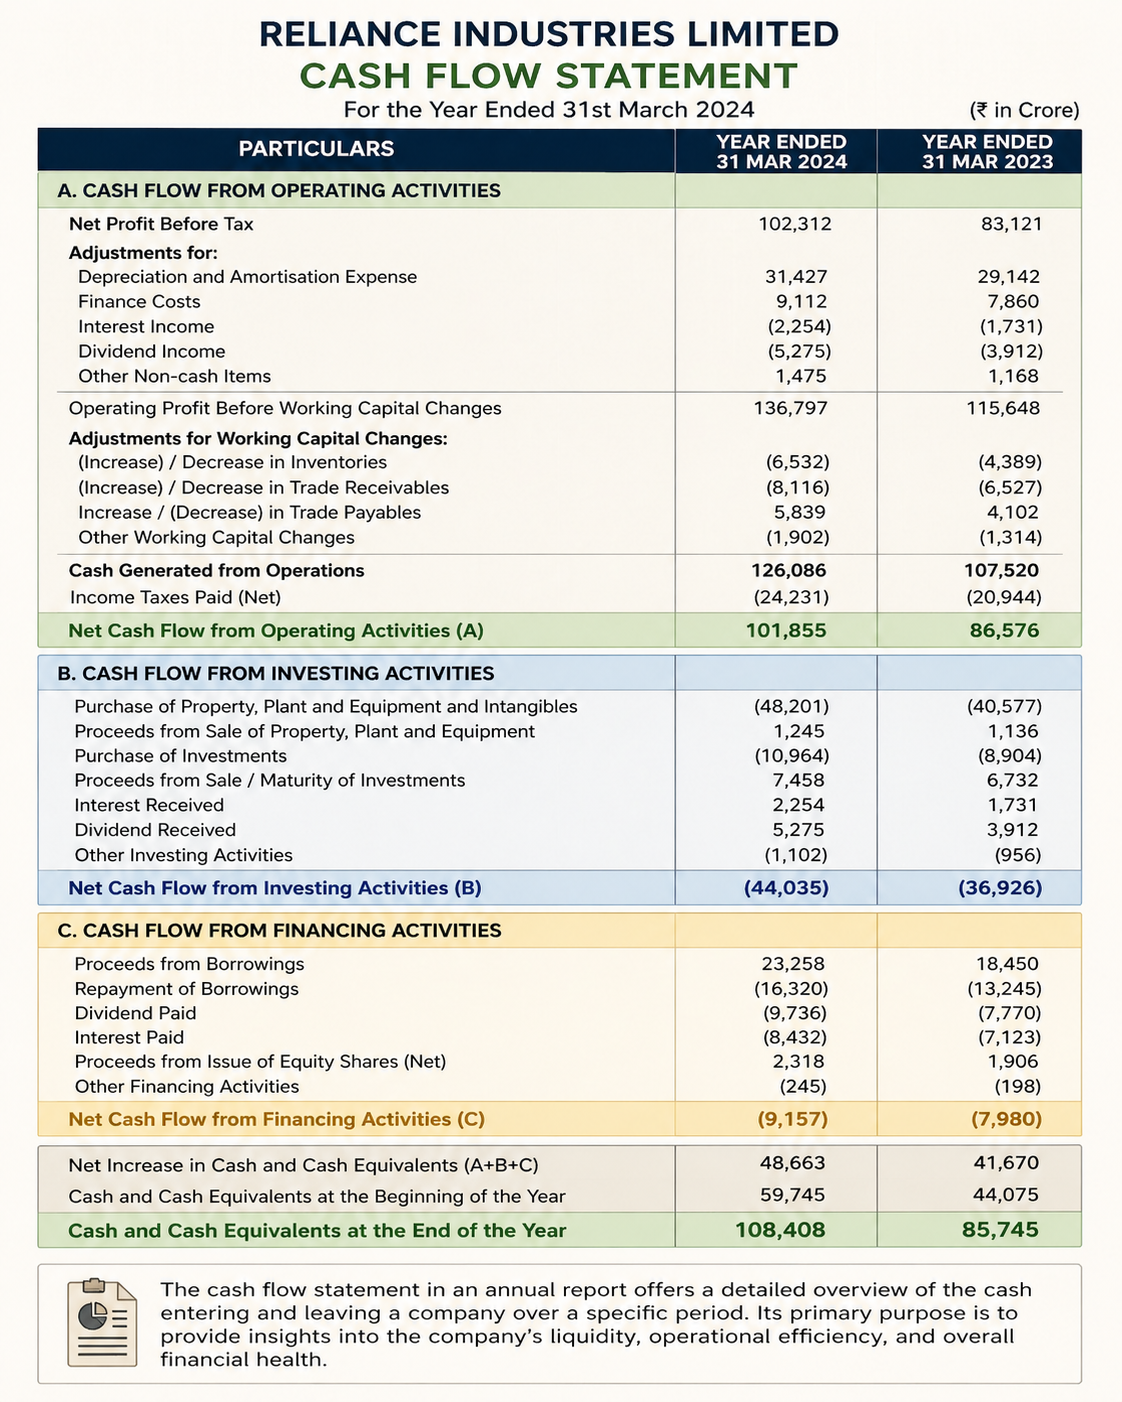
Company: Reliance Industries Limited
Period: For the Year Ended 31st March 2024
(₹ in Crore)
Cash Flow from Operating Activities
- Net Profit Before Tax: ₹1,02,312
- Adjustments:
- Depreciation & Amortisation: ₹31,427
- Finance Costs: ₹9,112
- Interest Income: ₹(2,254)
- Dividend Income: ₹(5,275)
- Other Non-Cash Items: ₹1,475
- Operating Profit Before Working Capital Changes: ₹1,36,797
Changes in Working Capital:
- Increase in Inventories: ₹(6,532)
- Increase in Trade Receivables: ₹(8,116)
- Increase in Trade Payables: ₹5,839
- Other Changes: ₹(1,902)
- Cash Generated from Operations: ₹1,26,086
- Income Tax Paid: ₹(24,231)
Net Cash Flow from Operating Activities (A): ₹1,01,855
Cash Flow from Investing Activities
- Purchase of Assets: ₹(48,201)
- Sale of Assets: ₹1,245
- Purchase of Investments: ₹(10,964)
- Sale/Maturity of Investments: ₹7,458
- Interest Received: ₹2,254
- Dividend Received: ₹5,275
- Other Investing Activities: ₹(1,102)
Net Cash Flow from Investing Activities (B): ₹(44,035)
Cash Flow from Financing Activities
- Borrowings: ₹23,258
- Repayment of Borrowings: ₹(16,320)
- Dividend Paid: ₹(9,736)
- Interest Paid: ₹(8,432)
- Issue of Shares: ₹2,318
- Other Financing Activities: ₹(245)
Net Cash Flow from Financing Activities (C): ₹(9,157)
Net Cash Position
- Net Increase in Cash (A + B + C): ₹48,663
- Opening Cash Balance: ₹59,745
Closing Cash Balance: ₹1,08,408
Key Insight
This example shows strong operating cash flow from core business activities, negative investing cash flow due to expansion, and mixed financing cash flow from borrowings and dividend payments.
What Are The Red Flags In the Cash Flow Statement?
Key areas of concern include non-recurring cash inflows/outflows and the combination of high debt with low cash flow. Let’s delve into these red flags and how they impact a company’s financial stability.
Non-Recurring Cash Inflows/Outflows: Identifying Unusual Items
Non-recurring cash items, like one-time asset sales, can make cash flow appear stronger than it is. This can lead to poor decisions about dividends, investments, or debt. Relying on such cash inflows often signals core business issues.
High Debt and Low Cash Flow: Indicating Possible Liquidity Issues
When a company has high debt but low cash flow, it risks financial instability. Limited cash means difficulty repaying loans, reduced flexibility for investments, higher borrowing costs, and signs of weak core business operations.
Vodafone Idea (Vi) struggles with high debt and low cash flow, making it difficult to repay loans and cover interest. Most cash goes to debt payments, limiting funds for network expansion. This financial strain leads to higher borrowing costs and signals instability, leaving Vi reliant on loans to operate.
What are the key differences between accrual accounting and cash accounting?
The key differences between accrual accounting and cash accounting, as reflected in the cash flow statement, lie in the timing of when revenues and expenses are recorded. In accrual accounting, revenues and expenses are recorded when they are earned or incurred, regardless of when the actual cash is received or paid. This means that accounts receivable and accounts payable are included in the financial statements, providing a more accurate picture of a company’s financial performance over a period.
On the other hand, cash accounting records revenues and expenses only when cash actually changes hands, making it simpler but potentially less reflective of the true financial health of a business. The cash flow statement bridges this gap by showing the actual cash inflows and outflows from operating, investing, and financing activities, highlighting how accrual-based net income is adjusted for changes in working capital and non-cash transactions to reflect real cash movement. This allows stakeholders to see the true liquidity position of the business, irrespective of when revenues and expenses are recognised under accrual accounting.
How Can a Company Improve Its Cash Flow?
Improving cash flow is essential for a company’s financial health and long-term sustainability. By adopting strategic practices, businesses can enhance cash inflows, manage outflows, and maintain sufficient liquidity to support operations and growth. Key actions a company can take include:
Speed up Accounts Receivable Collection
Implement stricter credit policies, offer early payment discounts, and follow up promptly on overdue invoices to ensure faster cash inflows.
Negotiate Better Payment Terms with Suppliers
Extend payment deadlines where possible to delay cash outflows without harming supplier relationships.
Control Operating Expenses
Reduce unnecessary overhead costs, delay non-essential spending, and focus on cost-effective operations to improve cash retention.
Improve Inventory Management
Optimise inventory levels to avoid overstocking, reduce storage costs, and free up cash tied up in unsold goods.
Use Short-Term Financing Wisely
Utilise options like a line of credit or business loans to cover temporary cash shortfalls and maintain smooth operations.
Regularly Monitor Cash Flow
Keep a close eye on the cash flow statement, forecast future cash needs, and plan to prevent liquidity issues and support strategic decisions.
Conclusion
Cash flow is essential in stock market analysis as it reveals a company’s actual cash position, highlighting its liquidity and ability to fund growth and handle obligations. Regularly reviewing the cash flow statement helps investors see beyond reported profits, providing a clearer picture of operational health and financial stability.
Analysing cash flow from operating, investing, and financing activities also shows how effectively a company manages cash, supporting more informed investment choices. By tracking cash flow ratios like FCF yield and cash flow margin, investors gain insights into a company’s efficiency, resilience, and growth potential over time.
Frequently Asked Questions (FAQs)
What is the cash flow statement?
A cash flow statement shows the cash a company receives and spends over a specific period. It provides insights into the company’s cash health, covering operations, investments, and financing.
What are the three types of cash flow statements?
The cash flow statement includes three sections: operating activities (day-to-day business), investing activities (buying/selling assets), and financing activities (loans, issuing stock).
Each shows how cash moves in these areas.
What is the cash flow formula?
Cash flow can be calculated as: Cash Flow = Cash Inflows – Cash Outflows. It shows how much cash remains after paying for all expenses and investments.
What Does a Negative Cash Flow From Financing Mean?
If a business is facing negative cash flow, it means there has been a net decrease in cash, often due to financing activities. This typically happens when the company is repaying debt, settling other obligations, or buying back shares.
When Capital Expenditures Increase, What Happens to Cash Flow?
This negatively affects the cash flow in the short term because capital expenditures involve a large upfront investment to purchase the assets, which reduces the cash available for other uses.
Disclaimer: This content is for educational purposes only and does not constitute financial or investment advice. Investments in securities or other financial instruments are subject to market risk, including partial or total loss of capital. Past performance is not indicative of future results. Always consider your financial situation carefully and consult a licensed financial advisor before making investment or trading decisions.
Table of Content
- Key Points
- What is a Cash Flow Statement?
- What Are The Components Of a Cash Flow Statement?
- Importance of Cash Flow Statement
- How to Calculate Cash Flow?
- How to Read a Cash Flow Statement?
- Cash Flow Analysis for Investors
- Cash Flow vs. Profitability
- Cash Flow Ratios
- Example of Cash Flow Statement
- What Are The Red Flags In the Cash Flow Statement?
- What are the key differences between accrual accounting and cash accounting?
- How Can a Company Improve Its Cash Flow?
- Conclusion
- Frequently Asked Questions (FAQs)
Engineered for the obsessed. Built for traders.

Purpose-built terminals.
Zero compromise.
Built for speed.
Plot No 1290, 2nd Floor, 17th Cross, 5th Main, Sector-7, HSR Layout, Bangalore 560102
Follow us on
Mintcap Brokers Private Limited
CIN – U66110KA2023PTC178706 | Registered Address: Plot No 1290, Second Floor, 17th Cross, 5th Main, Sector-7, HSR Layout, Bangalore 560102 | Tel: 080 – 49552310 | Email ID: compliance@capmint.com | SEBI registered Stock Broker: INZ000322732 | NSE Cash/F&O Member ID: 90430 | BSE Cash/F&O Member ID: 6903 | MCX Member ID: 57400 | NCDEX Member ID: 1312 | SEBI registered Depository Participant: IN-DP-806-2025 | CDSL DP ID: 12102300 | NSE Clearing Member code: M70108 | AMFI-Registered Mutual Fund Distributor: ARN-289109 (Valid upto 28-Feb-2027) | Category II Execution Only Platform : E6903
Details of Client Bank Account
Compliance Officer: Ms. Shridevi Vungarala | Email ID: compliance@capmint.com | Tel no. + 91 9035330126 | Grievance Redressal Officer (GRO) – Ms. Shikha Gupta | Email ID: Grievance@capmint.com | Tel no: 9035331595.
Procedure to file a complaint on SEBI SCORES: Register on SCORES portal. Mandatory details for filing complaints on SCORES: Name, PAN, Address, Mobile Number, E-mail ID. Benefits: Effective Communication, Speedy redressal of the grievances. You may refer the website https://scores.sebi.gov.in/ for more information. You may also download the SEBI Scores app to log a complaint Android: https://play.google.com > store > apps > sebiscores iOS: https://apps.apple.com > app > sebiscores
Disclaimer
Investment in the securities market are subject to market risks, read all the related documents carefully before investing. Brokerage will not exceed the SEBI prescribed limit.
Mutual fund investments are subject to market risks, read all scheme related documents carefully before investing. Mutual Funds are not exchange-traded products.
Attention Investor:
- Stock Brokers can accept securities as margin from clients only by way of pledge in the depository system w.e.f. September 1, 2020.
- Update your mobile number & email Id with your stock broker/depository participant and receive OTP directly from depository on your email id and/or mobile number to create pledge.
- Pay 20% as upfront margin of the transaction value to trade in cash market segment.
- Investors may please refer to the Exchange’s Frequently Asked Questions (FAQs) issued vide circular reference NSE/INSP/45191 dated July 31, 2020 and NSE/INSP/45534 dated August 31, 2020 and other guidelines issued from time to time in this regard.
- Check your Securities /MF/ Bonds in the consolidated account statement issued by NSDL/CDSL every month.