
Table of Content
- Key Takeaways
- What Is a Balance Sheet?
- How does the Balance Sheet work?
- What Is the Difference Between a Standalone And a Consolidated Balance Sheet?
- What Are The Components In the Balance Sheet?
- Features of Balance Sheet
- Importance of Balance Sheet
- Example of Balance Sheet
- How Should Investors Use the Balance Sheet?
- How Companies Use Balance Sheets to Manipulate Investors?
- Limitations of Balance Sheet
- Ratio’s Interpretation In the Balance Sheet
- Conclusion
- Frequently Asked Questions (FAQs)
- Related Topics:
Link copied!
Balance Sheet
The balance sheet is a financial statement that provides a snapshot of a company’s assets and liabilities, helping investors understand its economic health. This information is typically available in the company’s annual report.
Key Takeaways
- A balance sheet shows a company’s financial health by listing what it owns (assets) and owes (liabilities), helping investors see its value.
- A standalone balance sheet shows just the parent company’s finances, while a consolidated one includes its subsidiaries for a complete picture.
- Key ratios like current ratio, quick ratio, and debt-to-equity help investors quickly assess a company’s stability and growth potential.
What Is a Balance Sheet?
The balance sheet provides insights into a company’s financial status by detailing its assets, liabilities, and equity. It indirectly reflects the company’s net worth through the fundamental accounting equation:
Assets = Liabilities + Shareholders’ Equity
Shareholders’ equity is listed under the liabilities section, as it represents the company’s obligations to its owners. Together with the income statement and cash flow statement, the balance sheet helps analysts and stock market participants assess the financial health of a company.
How does the Balance Sheet work?
A balance sheet works by showing what a company owns (assets), what it owes (liabilities), and the value left for shareholders (equity) at a specific point in time. It follows a simple accounting principle:
Assets = Liabilities + Shareholders’ Equity
Every transaction a company makes affects at least one side of this equation. For example, if a company takes a loan from a bank, both its cash (asset) and debt (liability) increase. If it purchases machinery using cash, one asset (cash) decreases while another asset (machinery) increases.
Because of this structure, the balance sheet always remains balanced. Investors use it to understand how a company finances its operations, whether through borrowed funds or shareholder capital, and how effectively it is using its resources to create value.
What Is the Difference Between a Standalone And a Consolidated Balance Sheet?
Companies sometimes include their subsidiaries in what’s known as a consolidated balance sheet. The critical difference between a consolidated and a standalone balance sheet lies in the scope of financial information:
Standalone Balance Sheet
A standalone balance sheet provides financial information solely for the single entity of the company, excluding any subsidiaries or affiliates. It reflects only the assets and liabilities of the individual company, offering insight into its specific financial position.
Consolidated Balance Sheet
A consolidated balance sheet combines the financials of all subsidiaries or ventures under the parent company, including their assets and liabilities. This approach provides a comprehensive business overview, reflecting the total resources, obligations, and equity held by the entire group.
For Reliance Industries Limited, analysing the consolidated balance sheet provides a complete view of its financial health. Reliance’s standalone statement excludes key contributions from subsidiaries like Reliance Jio and Reliance Retail. The consolidated view better reflects growth, profitability, and risk across all segments, which is essential for an accurate performance assessment.
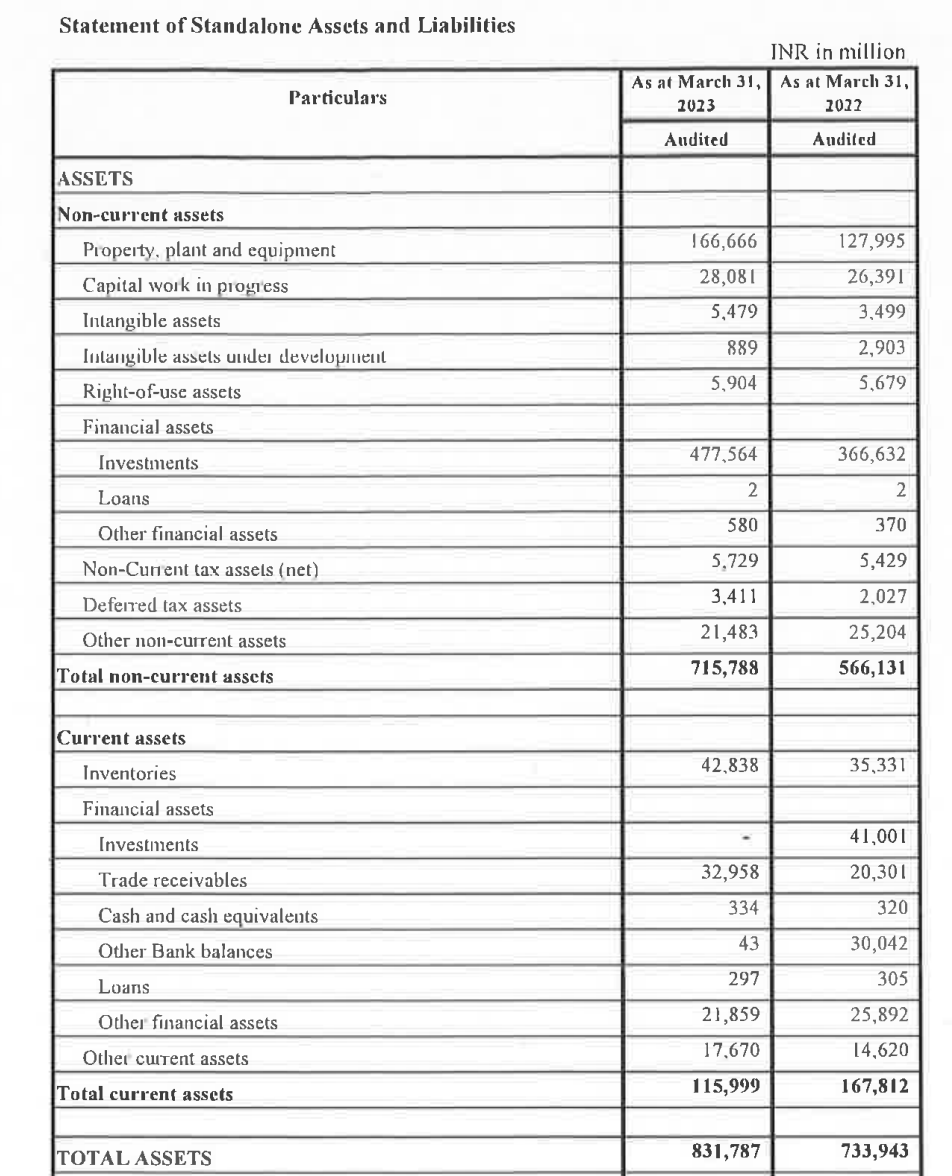
What Are The Components In the Balance Sheet?
The financial statement is divided into two main categories: assets and liabilities. Assets represent resources owned by the company that are expected to provide economic value in the future. Liabilities, on the other hand, represent obligations the company has taken on, which will require repayment or settlement, potentially offering economic value in the future as well.
Assets
Simply put, assets are resources owned by the company that can be converted into cash. There are various types of assets, such as current assets, non-current assets, cash equivalents, and company inventory. The company utilises these assets to generate revenue.
The image below shows the assets section of the balance sheet for Maruti Suzuki, detailing the resources owned by the company.
Liabilities
Liabilities represent money borrowed by the company from banks and investors to fund its operations, purchase inventory, and generate revenue. Liabilities are categorised into different sections, such as long-term and short-term liabilities.
Maruti Suzuki’s liabilities include short-term borrowings of ₹33.10 crore and trade payables of ₹14,582.40 crore as of March 2024. These funds are utilised to finance operations, procure inventory, and generate revenue.
Shareholders Equity
The book value of the company represents its net worth, calculated as the total amount remaining if all assets were sold and all debts were paid off.
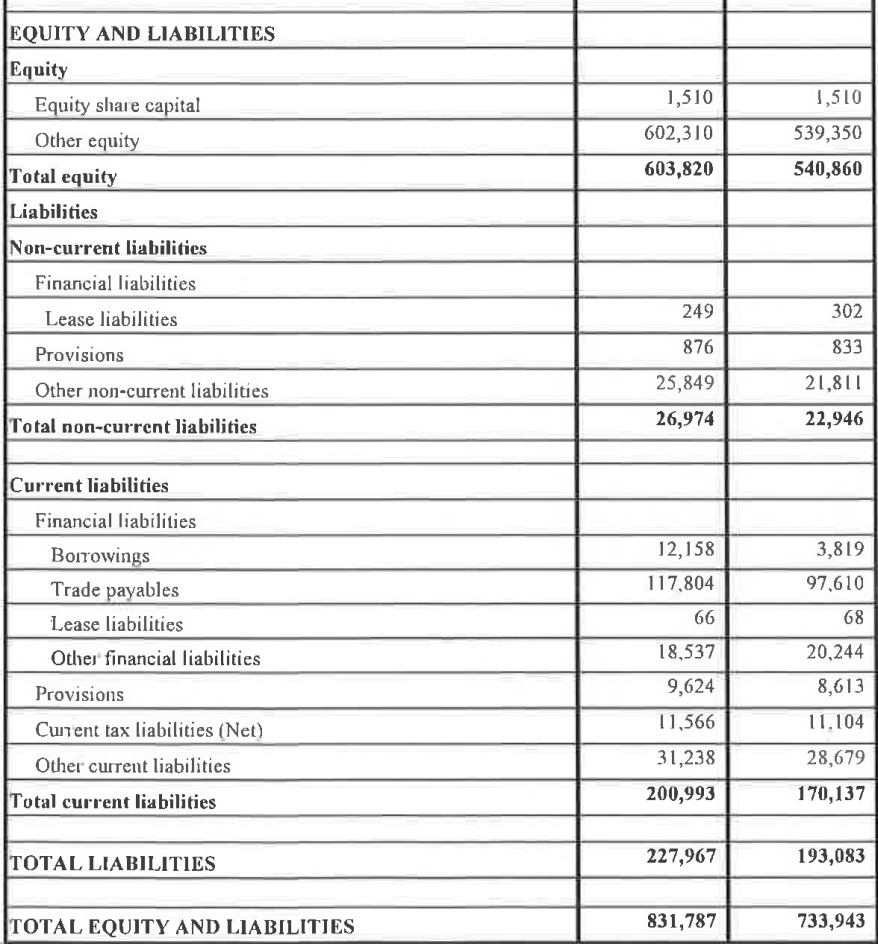
As shown in the image above, equity represents shareholders’ capital, and it is presented alongside liabilities in the same section for Maruti Suzuki.
Features of Balance Sheet
Snapshot of Financial Position
A balance sheet shows the company’s financial position at a specific point in time rather than over a period.
Divided Into Assets, Liabilities, and Equity
The statement is organised into three major sections that provide a complete view of the company’s financial structure.
Based on Historical Data
Most assets and liabilities are recorded based on accounting standards and historical transactions rather than current market value.
Helps Assess Liquidity and Solvency
Investors can evaluate the company’s ability to meet short-term obligations and long-term financial commitments.
Forms the Foundation for Ratio Analysis
Important ratios such as the Current Ratio, Quick Ratio, Debt-to-Equity Ratio, and Return on Equity are derived from the balance sheet.
Mandatory Financial Disclosure
Listed companies are required to publish balance sheets as part of their annual and quarterly financial reporting requirements.
Importance of Balance Sheet
The balance sheet is one of the most important financial statements because it provides a complete overview of a company’s financial health. It helps investors understand what the company owns, what it owes, and how much value belongs to shareholders.
For investors, the balance sheet is useful for assessing liquidity, debt levels, operational stability, and long-term sustainability. A company with strong assets, manageable liabilities, and growing shareholders’ equity is generally considered financially healthy.
The balance sheet also helps analysts compare companies within the same industry and identify potential risks that may not be visible in the income statement alone. It acts as the foundation for many financial ratios and valuation methods used in investment analysis.
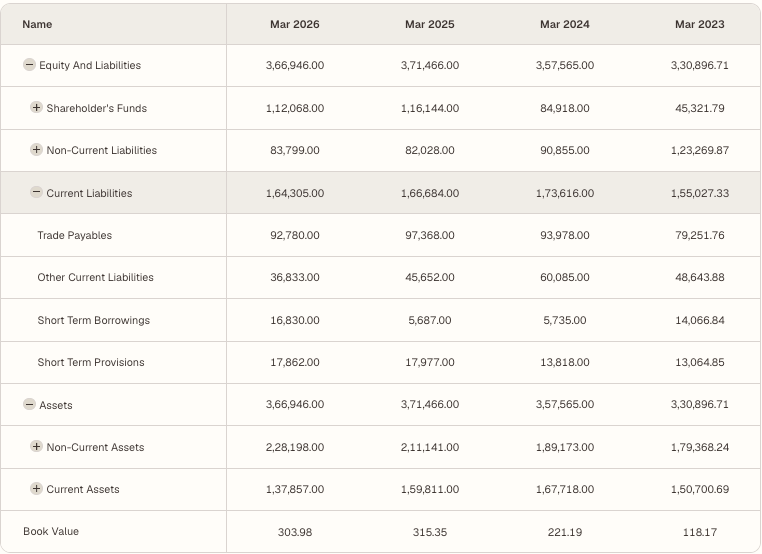
Example of Balance Sheet
Given below is an example of the balance sheet of Tata Motors Ltd.
How Should Investors Use the Balance Sheet?
Investors rely on the balance sheet to make informed investment decisions, as it provides a comprehensive overview of the company’s financial position since its inception. Here are some ways investors use the balance sheet for making investment decisions
Interpreting Assets Section
In the assets section, examine the current assets to ensure they are at a healthy level, as this indicates the company’s ability to meet its short-term obligations. Additionally, inventory levels should be reviewed to see if they are high, which may signal slow growth for the company.
In the non-current assets section, you get a long-term view of the company, including assets like property, machinery, and equipment. For capital-intensive industries, such as manufacturing, substantial non-current assets are common, but excessively high levels could indicate a heavy debt burden. Also, assess intangible assets, like patents, for their potential to add future value; however, be cautious if these assets appear overvalued.
Interpreting Liabilities Section
Start by looking at current liabilities. If they are higher than current assets, the company might face liquidity issues. High accounts payable or accrued expenses could also suggest cash flow problems.
For long-term debt, excessive levels may make it hard for the company to cope during economic downturns, while low debt levels often indicate financial stability. To assess how much debt the company has taken on, compare debt to equity or debt to assets. Typically, a lower debt-to-equity ratio means the company is more financially stable.
In the liabilities section, you’ll also find shareholders’ equity. Here, check if retained earnings are high and growing; this indicates that the company is expanding and reinvesting in its growth rather than depending on debt.
A high level of equity investment can reflect strong investor confidence. Additionally, compare the book value per share with the stock price. If the stock price is much higher, it might suggest the stock is overvalued (or undervalued if the stock price is much lower than the book value).
How Companies Use Balance Sheets to Manipulate Investors?
Investors should be aware that companies can sometimes make their balance sheets appear stronger than they actually are.
Aggressive Asset Valuation
Companies may overvalue assets such as land, investments, goodwill, or inventories, making the business appear financially stronger.
Hiding Debt Through Subsidiaries
Some companies move liabilities to subsidiaries or joint ventures, making debt levels appear lower in standalone statements.
Inflating Receivables
A company may report high receivables that are difficult to collect, artificially boosting asset values.
Window Dressing
Near the reporting date, management may temporarily reduce debt or increase cash balances to improve financial ratios.
Excessive Capitalisation
Instead of recording expenses immediately, some companies classify them as assets, temporarily increasing profits and net worth.
What Should Investors Focus On?
Rather than looking only at total assets or net worth, investors should focus on:
- Cash and cash equivalents
- Debt-to-equity ratio
- Current ratio
- Quality of receivables
- Inventory growth versus revenue growth
- Free cash flow trends
- Retained earnings growth
- Consolidated balance sheet instead of only standalone statements
Limitations of Balance Sheet
Historical Cost Accounting
Many assets are recorded at their original purchase price rather than current market value, which may not reflect their actual worth today.
Doesn’t Show Future Potential
The balance sheet reflects past and present financial conditions but does not directly indicate future growth prospects.
Intangible Assets May Be Understated
Strong brands, intellectual property, management quality, and customer loyalty are often not fully reflected.
Can Be Influenced by Accounting Policies
Different accounting methods can affect asset valuation, depreciation, and liability recognition.
Provides a Snapshot Only
The balance sheet represents a single date and may not reflect fluctuations that occur throughout the year.
Ratio’s Interpretation In the Balance Sheet
When analysing a balance sheet, using critical financial ratios can provide straightforward insights into the company’s financial health. Here are some critical ratios:
Current ratio
Current Assets / Current Liabilities – Measures the company’s ability to cover short-term obligations. A higher ratio indicates stronger liquidity.
Quick Ratio:
(Current Assets – Inventory) / Current Liabilities – Assesses the company’s ability to meet short-term liabilities without relying on inventory sales, offering a quicker view of liquidity.
Debt-to-Equity Ratio
Total Liabilities / Shareholders’ Equity – Shows the extent of debt used to finance assets relative to equity. A lower ratio generally suggests lower risk.
Conclusion
A balance sheet is one of the most important tools for understanding a company’s financial strength. It provides a detailed picture of the assets owned by the company, the liabilities it owes, and the value available to shareholders. Investors use the balance sheet to assess liquidity, solvency, debt levels, and long-term stability.
However, the balance sheet should never be analysed in isolation. Combining it with the income statement and cash flow statement provides a more complete understanding of the company’s financial health. By focusing on key ratios, debt levels, cash reserves, and asset quality, investors can make better-informed investment decisions and identify potential risks before investing.
Frequently Asked Questions (FAQs)
What is meant by Balance Sheet?
A balance sheet is a financial statement that shows a company’s assets, liabilities, and shareholders’ equity at a specific point in time. It provides a snapshot of the company’s financial position and overall financial health.
How to Read a Balance Sheet?
Start by analysing the assets section to understand what the company owns. Then review liabilities to see how much debt and obligations the company has. Finally, examine shareholders’ equity to determine the company’s net worth and retained earnings. Financial ratios like the Current Ratio and Debt-to-Equity Ratio can help simplify the analysis.
What Is Included in the Balance Sheet?
A balance sheet consists of three main sections:
- Assets (current and non-current assets)
- Liabilities (current and long-term liabilities)
- Shareholders’ Equity (share capital, reserves, and retained earnings)
Together, these sections provide a complete picture of the company’s financial position.
Who Prepares the Balance Sheet?
The company’s finance and accounting team prepares the balance sheet according to accounting standards such as Ind AS in India. It is reviewed by management and audited by independent auditors before publication.
What is the Formula for a Balance Sheet?
The fundamental balance sheet equation is:
This equation ensures that all company resources are financed either through borrowed funds (liabilities) or shareholder capital (equity).
What is the purpose of a balance sheet?
The balance sheet provides a financial snapshot of a company at a specific point in time. Every company releases its balance sheet annually, and investors use this critical information to make informed investment decisions.
How does a balance sheet differ from an income statement?
The income statement shows the total revenues generated and expenses incurred to earn that revenue, while the balance sheet provides details about a company’s assets and liabilities. The income statement is released annually, whereas the balance sheet is updated at the end of each financial year.
What are common balance sheet ratios?
Common balance sheet ratios include the current ratio, quick ratio, and debt-to-equity ratio, all of which help assess a company’s financial position.
Related Topics:
Disclaimer: This content is for educational purposes only and does not constitute financial or investment advice. Investments in securities or other financial instruments are subject to market risk, including partial or total loss of capital. Past performance is not indicative of future results. Always consider your financial situation carefully and consult a licensed financial advisor before making investment or trading decisions.
Table of Content
- Key Takeaways
- What Is a Balance Sheet?
- How does the Balance Sheet work?
- What Is the Difference Between a Standalone And a Consolidated Balance Sheet?
- What Are The Components In the Balance Sheet?
- Features of Balance Sheet
- Importance of Balance Sheet
- Example of Balance Sheet
- How Should Investors Use the Balance Sheet?
- How Companies Use Balance Sheets to Manipulate Investors?
- Limitations of Balance Sheet
- Ratio’s Interpretation In the Balance Sheet
- Conclusion
- Frequently Asked Questions (FAQs)
- Related Topics:
Engineered for the obsessed. Built for traders.

Purpose-built terminals.
Zero compromise.
Built for speed.
Plot No 1290, 2nd Floor, 17th Cross, 5th Main, Sector-7, HSR Layout, Bangalore 560102
Follow us on
Mintcap Brokers Private Limited
CIN – U66110KA2023PTC178706 | Registered Address: Plot No 1290, Second Floor, 17th Cross, 5th Main, Sector-7, HSR Layout, Bangalore 560102 | Tel: 080 – 49552310 | Email ID: compliance@capmint.com | SEBI registered Stock Broker: INZ000322732 | NSE Cash/F&O Member ID: 90430 | BSE Cash/F&O Member ID: 6903 | MCX Member ID: 57400 | NCDEX Member ID: 1312 | SEBI registered Depository Participant: IN-DP-806-2025 | CDSL DP ID: 12102300 | NSE Clearing Member code: M70108 | AMFI-Registered Mutual Fund Distributor: ARN-289109 (Valid upto 28-Feb-2027) | Category II Execution Only Platform : E6903
Details of Client Bank Account
Compliance Officer: Ms. Shridevi Vungarala | Email ID: compliance@capmint.com | Tel no. + 91 9035330126 | Grievance Redressal Officer (GRO) – Ms. Shikha Gupta | Email ID: Grievance@capmint.com | Tel no: 9035331595.
Procedure to file a complaint on SEBI SCORES: Register on SCORES portal. Mandatory details for filing complaints on SCORES: Name, PAN, Address, Mobile Number, E-mail ID. Benefits: Effective Communication, Speedy redressal of the grievances. You may refer the website https://scores.sebi.gov.in/ for more information. You may also download the SEBI Scores app to log a complaint Android: https://play.google.com > store > apps > sebiscores iOS: https://apps.apple.com > app > sebiscores
Disclaimer
Investment in the securities market are subject to market risks, read all the related documents carefully before investing. Brokerage will not exceed the SEBI prescribed limit.
Mutual fund investments are subject to market risks, read all scheme related documents carefully before investing. Mutual Funds are not exchange-traded products.
Attention Investor:
- Stock Brokers can accept securities as margin from clients only by way of pledge in the depository system w.e.f. September 1, 2020.
- Update your mobile number & email Id with your stock broker/depository participant and receive OTP directly from depository on your email id and/or mobile number to create pledge.
- Pay 20% as upfront margin of the transaction value to trade in cash market segment.
- Investors may please refer to the Exchange’s Frequently Asked Questions (FAQs) issued vide circular reference NSE/INSP/45191 dated July 31, 2020 and NSE/INSP/45534 dated August 31, 2020 and other guidelines issued from time to time in this regard.
- Check your Securities /MF/ Bonds in the consolidated account statement issued by NSDL/CDSL every month.