

Link copied!
Best Indicator for Intraday Trading

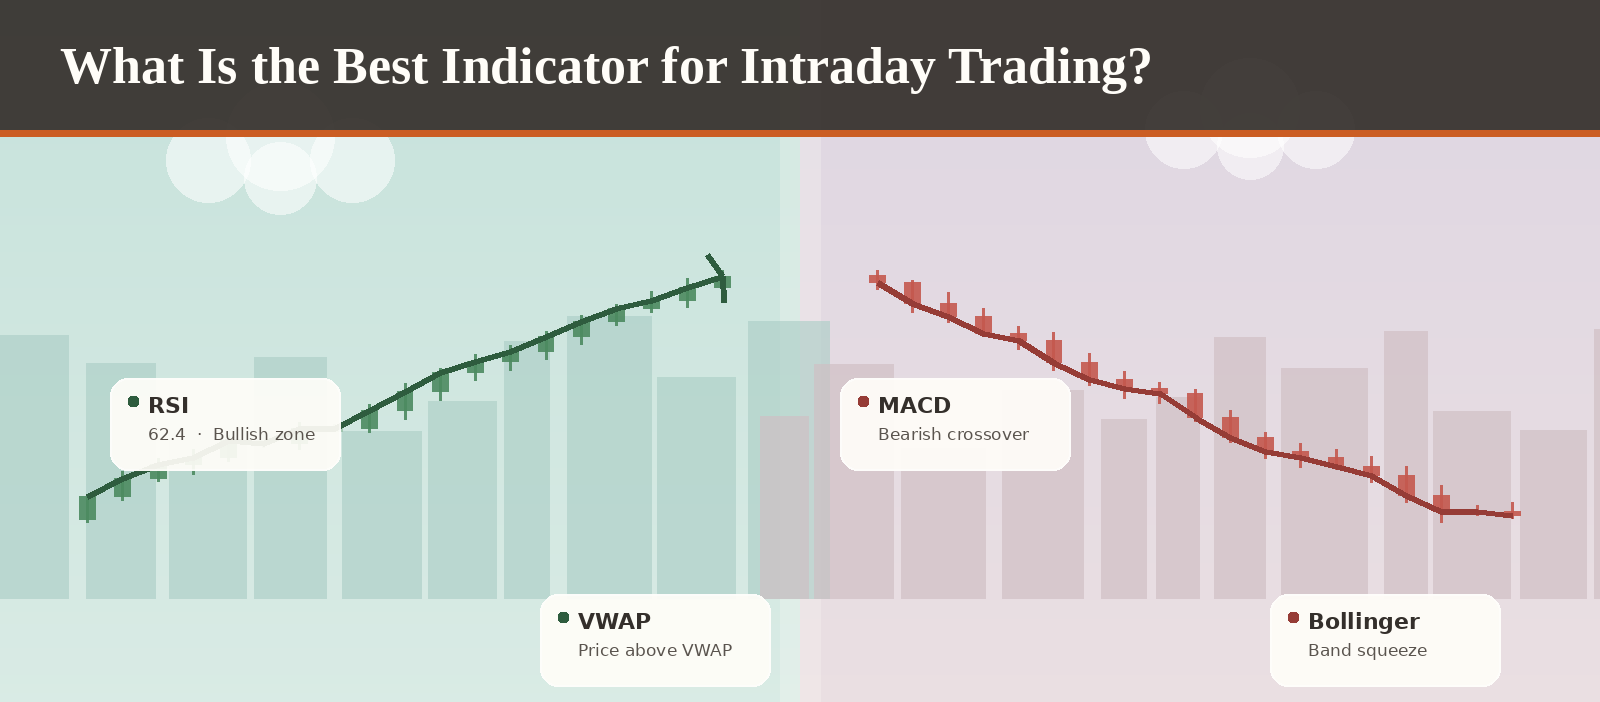
When it comes to intraday trading, one of the most common questions we hear from traders is: “Which indicator should I use?”
It’s a fair question. Intraday trading requires quick decisions; you’re in and out of trades within the same day, sometimes within minutes. A small delay or a wrong signal can make all the difference, and that’s exactly what we use indicators for: to make our trades better, even if by an inch.
Indicators don’t predict the exact future, but they give us valuable clues about price trends, momentum, volatility, and even the strength of buyers and sellers.
But here’s the truth: there isn’t a single “magic” indicator that always works. The best indicator for you depends on your trading style, the market you’re in, and how comfortable you are with risk.
Most experienced intraday traders build their approach around a small, tested shortlist of stock market indicators rather than chasing a new one every week. This article covers the best trading indicators for intraday trading, how they’re categorised, and further down, additional technical indicators for intraday trading (VWAP, Supertrend, Volume Profile, and Pivot Points) that round out the toolkit most active day traders draw from.
What Are Trading Indicators?
Think of indicators as tools in a mechanic’s toolbox. Each one is designed for a specific job. Some help identify whether the market is trending, others tell us if a stock is overbought or oversold, and some measure volatility so you know how wild the price swings might get.
Broadly, trading indicators fall into a few categories:
- Trend indicators: These help you figure out whether the market is moving up, down, or just sideways. Common ones are Moving Averages and MACD.
- Momentum indicators: These tell you how strong or weak a price move really is, basically, whether buyers or sellers are pushing harder. Examples include RSI and Stochastic.
- Volume indicators: Here, the focus is on participation. They show if a price move is happening with real backing from traders. OBV and VWAP are popular choices.
- Volatility indicators: These give you a sense of how much prices are swinging around. Tools like Bollinger Bands and ATR are often used.
- Overlays & oscillators: Overlays are indicators that sit directly on your price chart, like moving averages. Oscillators, on the other hand, move between ranges (like RSI or Stochastic) and help spot overbought or oversold zones.
How to Choose the Best Indicator for Intraday Trading?
Before jumping straight into the popular indicators, it’s important to know how to evaluate them. Ask yourself these questions:
What timeframe do I trade?
The timeframe you focus on changes which indicators make sense. If you’re trading very short-term charts, like 1-minute or 5-minute, you need indicators that react quickly, such as EMA or Stochastic. For slightly longer time frames, like 30-minute charts, slower indicators like SMA or MACD can give you a clearer picture without too much noise. Picking the wrong speed can either make you miss moves or trigger too many false signals.
What’s my trading style?
Are you a trend follower, looking to ride big moves, a breakout trader waiting for sudden price jumps, or a range trader buying low and selling high within a tight price band? Different styles need different tools. Trend followers rely on moving averages or MACD, breakout traders may use Bollinger Bands or VWAP, while range traders often prefer RSI or Stochastic to spot overbought and oversold levels.
Do I need confirmation?
One indicator alone rarely tells the full story. Combining two indicators that measure different things, for example, a trend indicator with a momentum indicator, can help confirm your trade signals. This reduces the chances of acting on a false signal and gives you more confidence in your decisions.
Am I overcomplicating things?
It’s tempting to add every indicator you read about, but more isn’t always better. Too many indicators can give conflicting signals and leave you frozen in indecision. Stick to a small set that complements your style and gives clear, actionable insights.
Now that we understand how to pick the right tools, let’s dive into the top indicators that intraday traders actually use.
Top Indicators for Intraday Trading
When it comes to intraday trading, the indicators mentioned below just work better than others because they give you quick results and are what most call leading indicators. They help you spot trends early, measure how strong a move is, check if the market is swinging too wildly, and see if buyers and sellers are really backing the price. All of this matters when you need to make decisions within the same trading day.
Moving Averages (SMA & EMA)
If you’re just starting out, moving averages are a great place to begin. Think of them as a way to smooth out all the daily price noise so you can clearly see which way the market is moving.
SMA (Simple Moving Average): This one takes the average of past prices over a set period. SMA gives you a general idea of the trend, but reacts slowly to sudden price changes.
EMA (Exponential Moving Average): EMA puts more weight on recent prices, so it reacts faster. This makes it useful for intraday traders who need quicker signals.
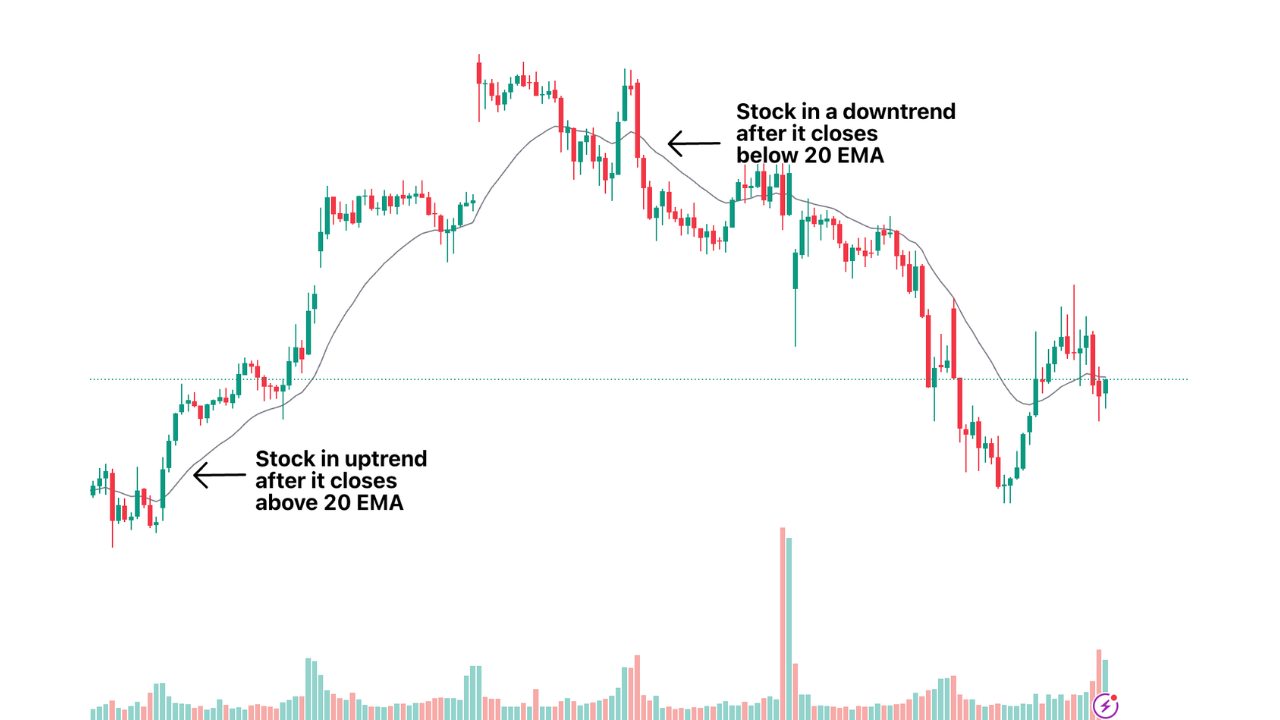
For Example, on a 15-minute chart, if the stock is trading above the 20-EMA, it usually signals that buyers are in control and the stock is bullish. If it drops below the 20-EMA, it could indicate weakness or a potential short-term downtrend.
Bollinger Bands
Bollinger Bands are a popular tool for traders because they show you how volatile a stock is and where it might reverse. Think of them as three lines on your chart: a middle line (usually a 20-period simple moving average) and two outer bands that expand and contract based on price movement.
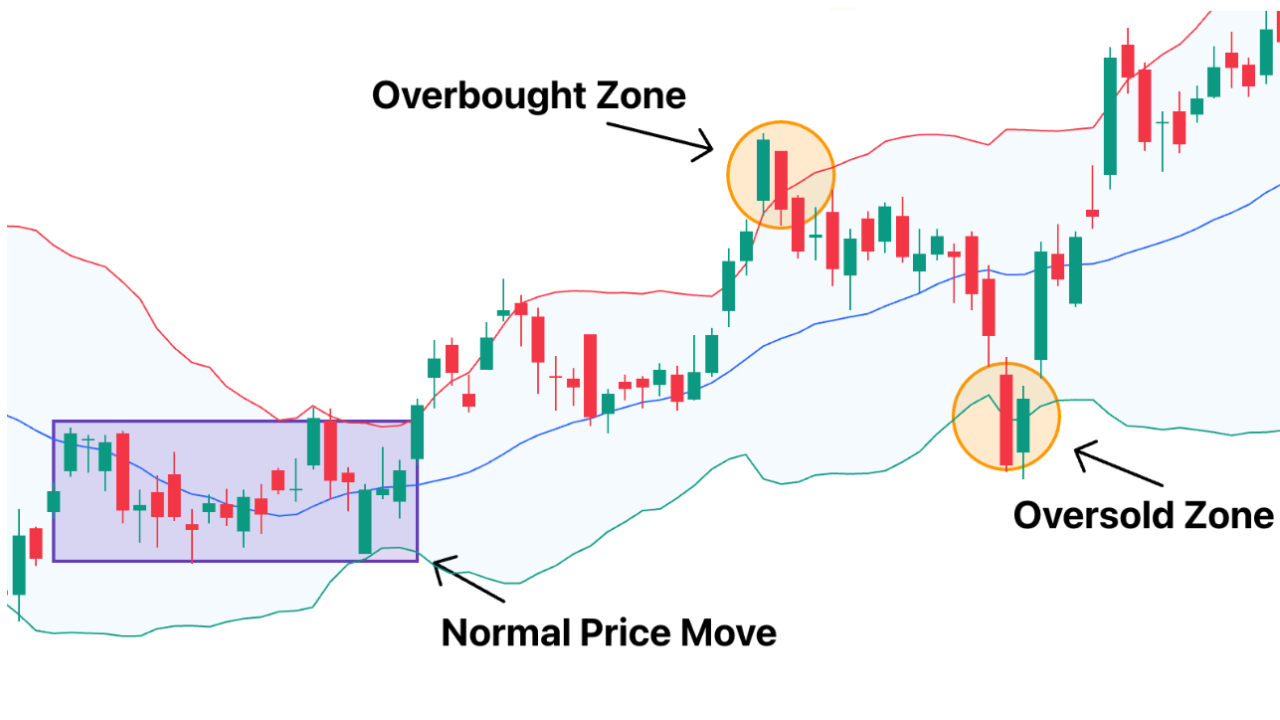
Upper Band: Sits above the middle line and shows the high range of normal price movement. When the price touches or crosses it, the stock might be overbought.
Middle Band: This is the simple moving average, giving you the average price over the past 20 periods. It helps you see the overall trend.
Lower Band: Located below the middle line, it shows the lower range. When the price hits it, the stock could be oversold and ready to bounce.
How to use it:
- When the bands tighten (a “squeeze”), it often signals that a big move is coming, although the direction isn’t clear.
- If the price touches the upper band, it can indicate the stock is overbought; touching the lower band can indicate it’s oversold.
- Combining Bollinger Bands with other indicators, like RSI or chart patterns, can make signals more reliable
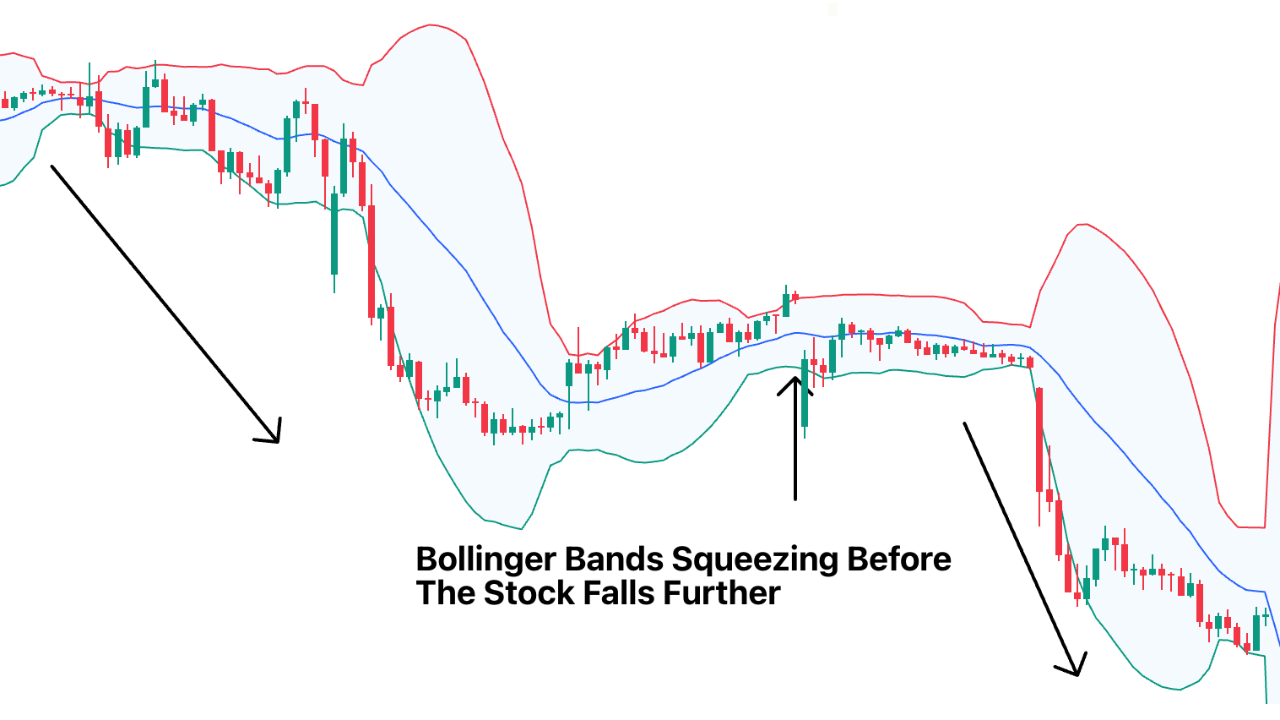
Bollinger Bands are simple but powerful. They help you read market volatility, spot potential reversals, and time trades better, especially when paired with other tools. Like any indicator, they’re most effective when practised and observed over time.
Relative Strength Index (RSI)
The Relative Strength Index, or RSI, is a momentum indicator that helps traders gauge the speed and strength of price movements. It moves between 0 and 100 and is primarily used to spot overbought or oversold conditions, giving you potential clues for entries and exits.
- When RSI is above 70, it often signals that a stock is overbought and could pull back soon.
- When RSI is below 30, it indicates the stock is oversold and may bounce back.
- Levels around 40–60 are considered neutral but can also help spot building momentum.
How to use it: RSI is commonly used for intraday trading to catch quick reversals or momentum shifts. For example, if RSI drops to 30 and then starts rising, it could be a good buy signal. Similarly, if RSI rises above 70 and starts falling, it could be a cue to sell.
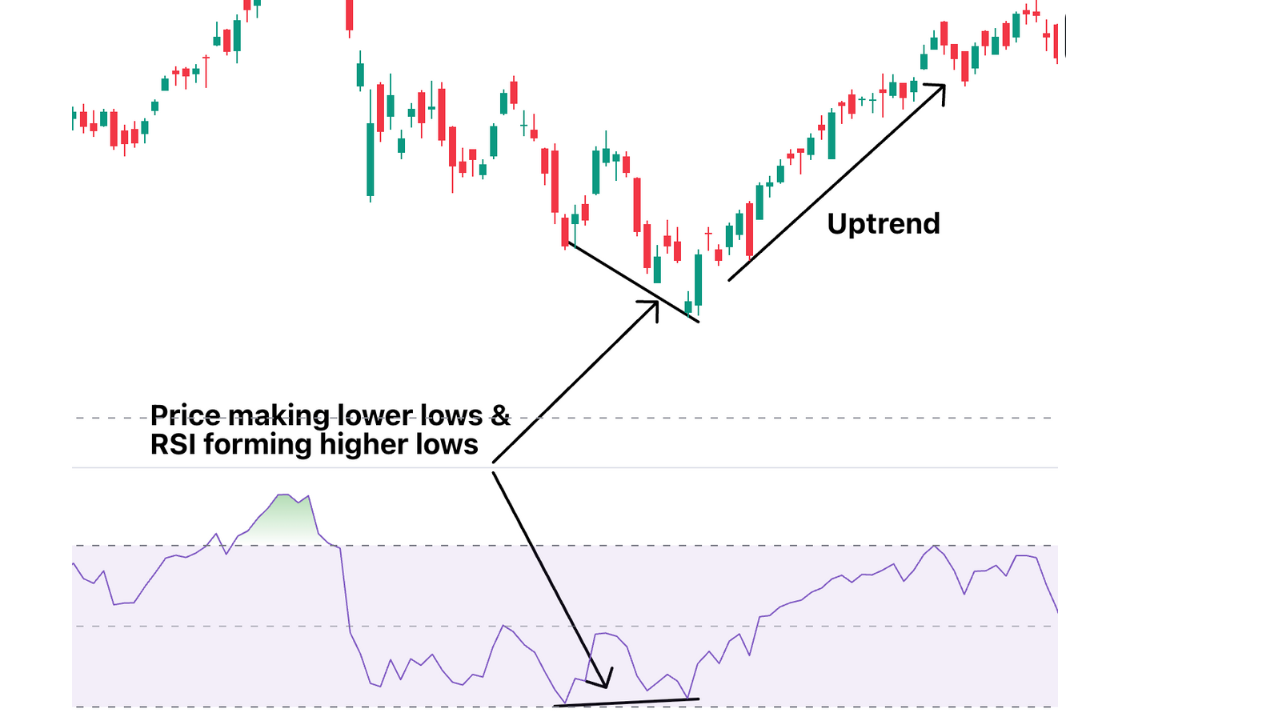
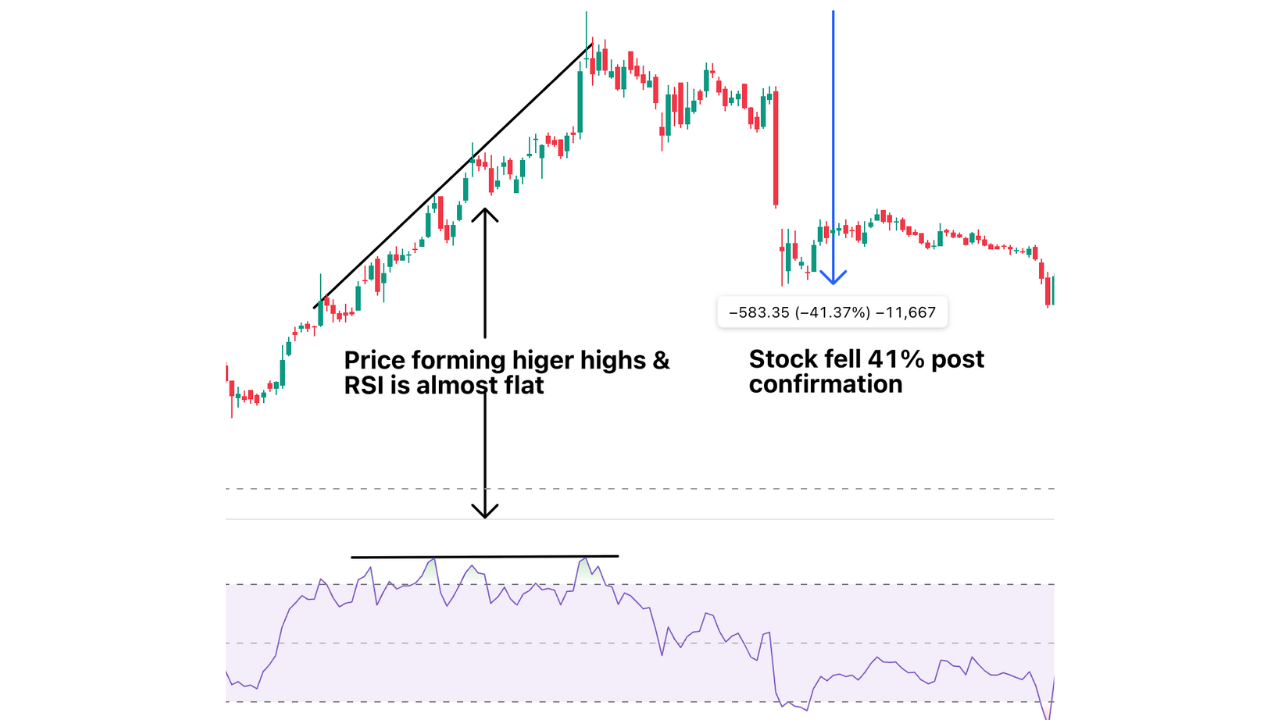
RSI also helps spot divergences:
- Bullish divergence occurs when price makes a lower low, but RSI forms a higher low, suggesting weakening selling pressure.
- Bearish divergence happens when the price makes a higher high, but RSI makes a lower high, signalling that buying strength is fading.
A quick note on settings: many traders adjust the RSI period by timeframe rather than using 14 everywhere, for instance, a shorter RSI (around 9) on 1-minute charts, the standard 14-period on 5-minute charts, and a longer 21-period on 15-minute charts, pairing each with slightly adjusted overbought/oversold levels (20/80 instead of 30/70 on faster timeframes) to reduce whipsaws.
MACD (Moving Average Convergence Divergence)
MACD is a versatile indicator that combines trend and momentum in one tool. It consists of two lines, the MACD line (blue line) and the Signal line (Red line), along with a histogram that shows the difference between the two.
- When the MACD line crosses above the Signal line from below, it’s usually a bullish signal, suggesting the stock could start moving up.
- When the MACD line crosses below the Signal line, it’s typically bearish, indicating potential downward momentum.
- The histogram helps visualise the strength of the trend: taller bars mean stronger momentum, while shrinking bars may signal weakening trends.
How to use it: MACD is great for spotting trend reversals and momentum shifts, especially on intraday charts. For example, a bullish crossover near a support level can be a strong buy signal, while a bearish crossover near resistance might signal an exit or short.
Keep in mind, MACD is a bit slower than RSI because it relies on moving averages, so it’s better for confirming trends rather than catching ultra-fast reversals.
MACD works best when combined with other tools like RSI, support/resistance zones, or candlestick patterns to reduce false signals and improve timing.
MACD + RSI is one of the most tested combinations among intraday traders: MACD confirms the direction of the trend while RSI times the entry, for example, going long when the MACD line crosses above its signal line while RSI is rising out of oversold territory. In backtests that layered in a mean-reversion filter alongside this combo, win rates around 70%+ have been reported over hundreds of trades, a reminder that pairing a trend/momentum indicator with a timing indicator tends to outperform using either alone (results vary by market and timeframe and should always be backtested on your own instrument before trading live).
Keltner Channels
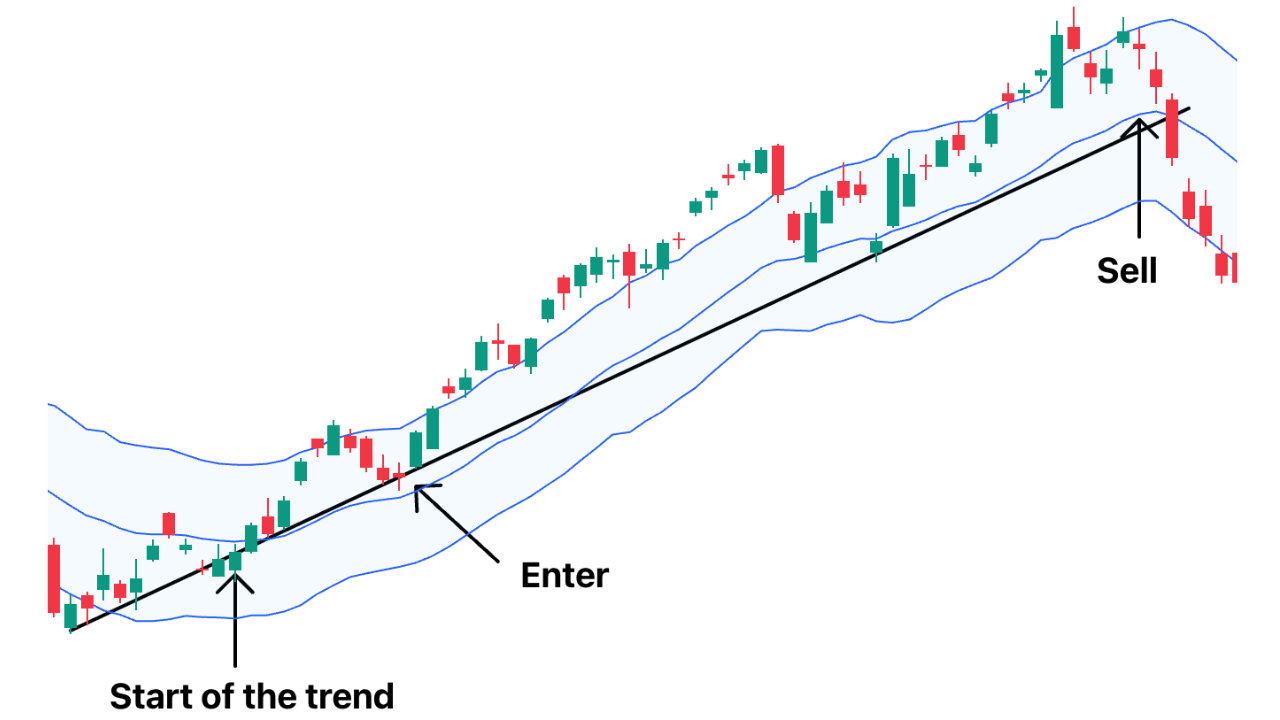
Keltner Channels are a volatility-based indicator that helps traders understand trends, breakout opportunities, and price behaviour relative to market swings. Think of them as three dynamic lines on your chart: a middle line (usually a 20-period EMA) and two outer bands that expand and contract based on the Average True Range (ATR).
Middle Line (EMA): Acts as the core of the channel, showing the overall trend direction by smoothing recent price action.
Upper Band: Calculated by adding a multiple of the ATR to the EMA. Prices near or above this band can signal strong bullish momentum.
Lower Band: Calculated by subtracting the same ATR multiple from the EMA. Price near this band can indicate bearish momentum or potential support.
How to use it:
- Entry on Pullback: If a stock is trending upward, a pullback to the middle EMA can act as a support level and a good entry point for long trades.
- Exit at Opposite Band: Riding a trend? Exiting near the opposite band helps capture gains while avoiding a reversal.
VWAP (Volume-Weighted Average Price)
VWAP is one of the most widely used stock market indicators among intraday and institutional traders, yet it didn’t appear in the original indicator list. It deserves its own section because it works differently from moving averages or oscillators.
VWAP calculates the average price a stock has traded at throughout the day, weighted by volume. Unlike a simple moving average, it resets every trading session, which makes it a true intraday-only tool.
How to use it:
- Price trading above VWAP is generally read as an intraday bullish bias; price below VWAP as a bearish bias.
- Many institutional desks use VWAP as a benchmark for “fair value” during the session, which is part of why price often reacts noticeably around it.
- A common setup: enter long when price breaks above VWAP on strong volume, treating VWAP as support; enter short when price breaks below VWAP on strong volume, treating it as resistance.
VWAP works best when combined with RSI or MACD. VWAP gives you the intraday bias, while the oscillator times your entry.
Supertrend
Supertrend is a trend-following indicator plotted directly on the price chart as a single line that flips above or below the price (and changes colour) as the trend changes.
How to use it:
- When the Supertrend line sits below price and is green, it signals an uptrend; when it sits above price and turns red, it signals a downtrend.
- It’s popular for intraday stop-loss placement traders to often trail their stop just behind the Supertrend line rather than using a fixed percentage.
- It pairs well with VWAP: VWAP confirms the intraday bias, and Supertrend helps manage the trade once you’re in it.
Volume Profile & OBV (On-Balance Volume)
The original list mentions OBV and VWAP briefly under “Volume indicators” Here’s a closer look at how each is actually used intraday.
OBV (On-Balance Volume) adds volume on up days and subtracts it on down days, creating a running total that shows whether volume is confirming or contradicting the price trend. A rising OBV alongside rising price confirms the trend; a rising price with falling OBV is a warning sign of a weakening move.
Volume Profile goes a step further by showing how much volume traded at each price level (not just over time). The price zones with the highest volume, often called high-volume nodes, tend to act as support or resistance, since a lot of buyers and sellers have already agreed that the price is “fair” there.
Pivot Points
Pivot Points are a simple, calculation-based indicator used heavily by day traders to map out intraday support and resistance before the market even opens.
How it works: Using the previous day’s high, low, and close, a central pivot level is calculated, along with support (S1, S2) and resistance (R1, R2) levels above and below it.
How to use it: If price is trading above the pivot, it leans bullish for the session; below the pivot, it leans bearish. The S1/S2 and R1/R2 levels act as potential reversal or profit-taking zones intraday.
Because it’s calculated before the session starts, Pivot Points are especially popular with traders who like to plan levels in advance rather than reacting to indicators in real time.
Comparing the Best Trading Indicators for Intraday Trading
|
Indicator |
Category |
What It Tells You |
Best Used With |
|---|---|---|---|
|
EMA/SMA |
Trend |
Trend direction |
RSI or MACD |
|
Bollinger Bands |
Volatility |
Overbought/oversold + volatility squeeze |
RSI |
|
RSI |
Momentum |
Overbought/oversold, divergence |
VWAP, MACD |
|
MACD |
Trend + Momentum |
Trend reversals, crossovers |
RSI, support/resistance |
|
Keltner Channels |
Volatility |
Breakouts, pullback entries |
Trend indicators |
|
VWAP |
Volume / Fair value |
Intraday bullish/bearish bias |
RSI, MACD |
|
Supertrend |
Trend |
Trend direction + stop-loss line |
VWAP |
|
OBV / Volume Profile |
Volume |
Confirms trend strength, key S/R zones |
Pivot Points, price action |
|
Pivot Points |
Support/Resistance |
Pre-market S/R levels |
VWAP, Volume Profile |
This table is a quick-reference summary of the indicators covered above. No single row is “the” answer; use it to decide which 2–3 to combine based on your own trading style.
Conclusion
Intraday trading relies on quick, informed decisions, and indicators help by showing trends, momentum, and volatility. Moving Averages highlight trend direction, Bollinger Bands and Keltner Channels track price swings, RSI signals overbought or oversold conditions, and MACD identifies trend reversals.
Understanding how each indicator works and practising with them is key to making smarter intraday trades.
Beyond this core group, VWAP, Supertrend, Volume Profile/OBV, and Pivot Points round out the toolkit most active intraday traders draw from, not because more indicators are better, but because knowing what each one is for makes it easier to pick the right 2–3 for your own style, as covered earlier.
Frequently Asked Questions (FAQs)
Which is the most accurate intraday indicator?
MACD is often considered reliable because it combines trend and momentum signals, helping traders identify both direction and strength of a move. However, its accuracy can vary depending on market volatility, chart timeframe, and the stock being traded.
Which indicator is best for entry/exit?
RSI and Stochastic are widely used for timing entries and exits. They indicate overbought and oversold conditions, helping traders spot potential reversals and short-term trading opportunities in real time.
How many indicators should I use?
Two or three are enough: one for trend, one for momentum, and one for confirmation. Using too many indicators can create confusion and conflicting signals, while a focused set helps make faster, more confident decisions.
Can beginners rely on just one indicator?
Yes, beginners can start with one like RSI or VWAP to keep things simple. As you gain experience, combining indicators can provide stronger confirmation and reduce the chance of false signals.
Is VWAP or a moving average better for intraday trading?
They serve different purposes rather than competing directly. VWAP resets daily and reflects volume-weighted fair value for that session, making it more relevant to true intraday bias, while moving averages (like EMA) smooth the price over a fixed number of periods regardless of the session. Many traders use both together, VWAP for intraday bias, EMA for shorter-term trend confirmation.
Do stock market indicators work the same way for options or futures intraday trading?
The core logic is the same, but volatility and volume patterns differ, so settings (like RSI period or ATR multiples in Keltner Channels) often need to be adjusted and backtested separately for each instrument rather than assumed to carry over directly from stocks.
After finishing Intraday Indicators, you can explore other Candlestick Patterns, the Supertrend Indicator, and the Technical Indicator.
Disclaimer: This content is for educational purposes only and does not constitute financial or investment advice. Investments in securities or other financial instruments are subject to market risk, including partial or total loss of capital. Past performance is not indicative of future results. Always consider your financial situation carefully and consult a licensed financial advisor before making investment or trading decisions.
Engineered for the obsessed. Built for traders.

Purpose-built terminals.
Zero compromise.
Built for speed.

Plot No 1290, 2nd Floor, 17th Cross, 5th Main, Sector-7, HSR Layout, Bangalore 560102
Follow us on


Mintcap Brokers Private Limited
CIN – U66110KA2023PTC178706 | Registered Address: Plot No 1290, Second Floor, 17th Cross, 5th Main, Sector-7, HSR Layout, Bangalore 560102 | Tel: 080 – 49552310 | Email ID: compliance@capmint.com | SEBI registered Stock Broker: INZ000322732 | NSE Cash/F&O Member ID: 90430 | BSE Cash/F&O Member ID: 6903 | MCX Member ID: 57400 | NCDEX Member ID: 1312 | SEBI registered Depository Participant: IN-DP-806-2025 | CDSL DP ID: 12102300 | NSE Clearing Member code: M70108 | AMFI-Registered Mutual Fund Distributor: ARN-289109 (Valid upto 28-Feb-2027) | Category II Execution Only Platform : E6903
Details of Client Bank Account
Compliance Officer: Ms. Shridevi Vungarala | Email ID: compliance@capmint.com | Tel no. + 91 9035330126 | Grievance Redressal Officer (GRO) – Ms. Shikha Gupta | Email ID: Grievance@capmint.com | Tel no: 9035331595.
Procedure to file a complaint on SEBI SCORES: Register on SCORES portal. Mandatory details for filing complaints on SCORES: Name, PAN, Address, Mobile Number, E-mail ID. Benefits: Effective Communication, Speedy redressal of the grievances. You may refer the website https://scores.sebi.gov.in/ for more information. You may also download the SEBI Scores app to log a complaint Android: https://play.google.com > store > apps > sebiscores iOS: https://apps.apple.com > app > sebiscores
Disclaimer
Investment in the securities market are subject to market risks, read all the related documents carefully before investing. Brokerage will not exceed the SEBI prescribed limit.
Mutual fund investments are subject to market risks, read all scheme related documents carefully before investing. Mutual Funds are not exchange-traded products.
Attention Investor:
- Stock Brokers can accept securities as margin from clients only by way of pledge in the depository system w.e.f. September 1, 2020.
- Update your mobile number & email Id with your stock broker/depository participant and receive OTP directly from depository on your email id and/or mobile number to create pledge.
- Pay 20% as upfront margin of the transaction value to trade in cash market segment.
- Investors may please refer to the Exchange’s Frequently Asked Questions (FAQs) issued vide circular reference NSE/INSP/45191 dated July 31, 2020 and NSE/INSP/45534 dated August 31, 2020 and other guidelines issued from time to time in this regard.
- Check your Securities /MF/ Bonds in the consolidated account statement issued by NSDL/CDSL every month.