
Link copied!
Stock Valuation Methods
Stock valuation is a critical part of investing because it helps determine whether a stock is priced fairly in the market. The valuation of shares allows investors to look beyond market noise, tips, and short-term price movements and focus on the underlying value of the business.
In this guide, stock valuation is explained simply and practically. It covers why valuation matters, how the main stock valuation methods work, and how investors apply them in real situations.
What Does Valuation of Shares Really Mean?
Stock valuation refers to the process of estimating the fair value of a company’s shares. The market price you see on your screen reflects demand and supply at a specific moment, but it does not always represent the actual worth of the underlying business.
The valuation of shares goes beyond price movements and focuses on fundamentals. It attempts to answer a core question: based on the company’s earnings, cash flows, growth potential, and risk profile, what should this stock be worth?
At times, the market price aligns closely with this intrinsic value. At other times, it can deviate significantly, either trading well above or below what the fundamentals justify. These deviations can persist for months or even years. A stock can remain overvalued for far longer than most investors expect, and similarly, an undervalued stock can continue falling before the market eventually recognises its worth. This is why valuation alone is not a timing tool; it is a framework for making better decisions over a full market cycle.
This difference between price and value is where investing opportunities arise. Investors who understand stock valuation aim to identify situations where the market price is below intrinsic value and remain cautious or exit when prices move far ahead of underlying business fundamentals.
Different Types of Stock Valuation Methods
If stock valuation were simple, every investor would arrive at the same value for a share. In reality, companies vary widely in size, business model, growth stage, and financial stability. This is why different methods of valuation of shares exist.
Some companies generate stable cash flows and regular dividends, while others reinvest aggressively to fuel future growth. Some operate in mature industries with predictable earnings, while others are still scaling and evolving. A single valuation approach cannot accurately capture all these differences.
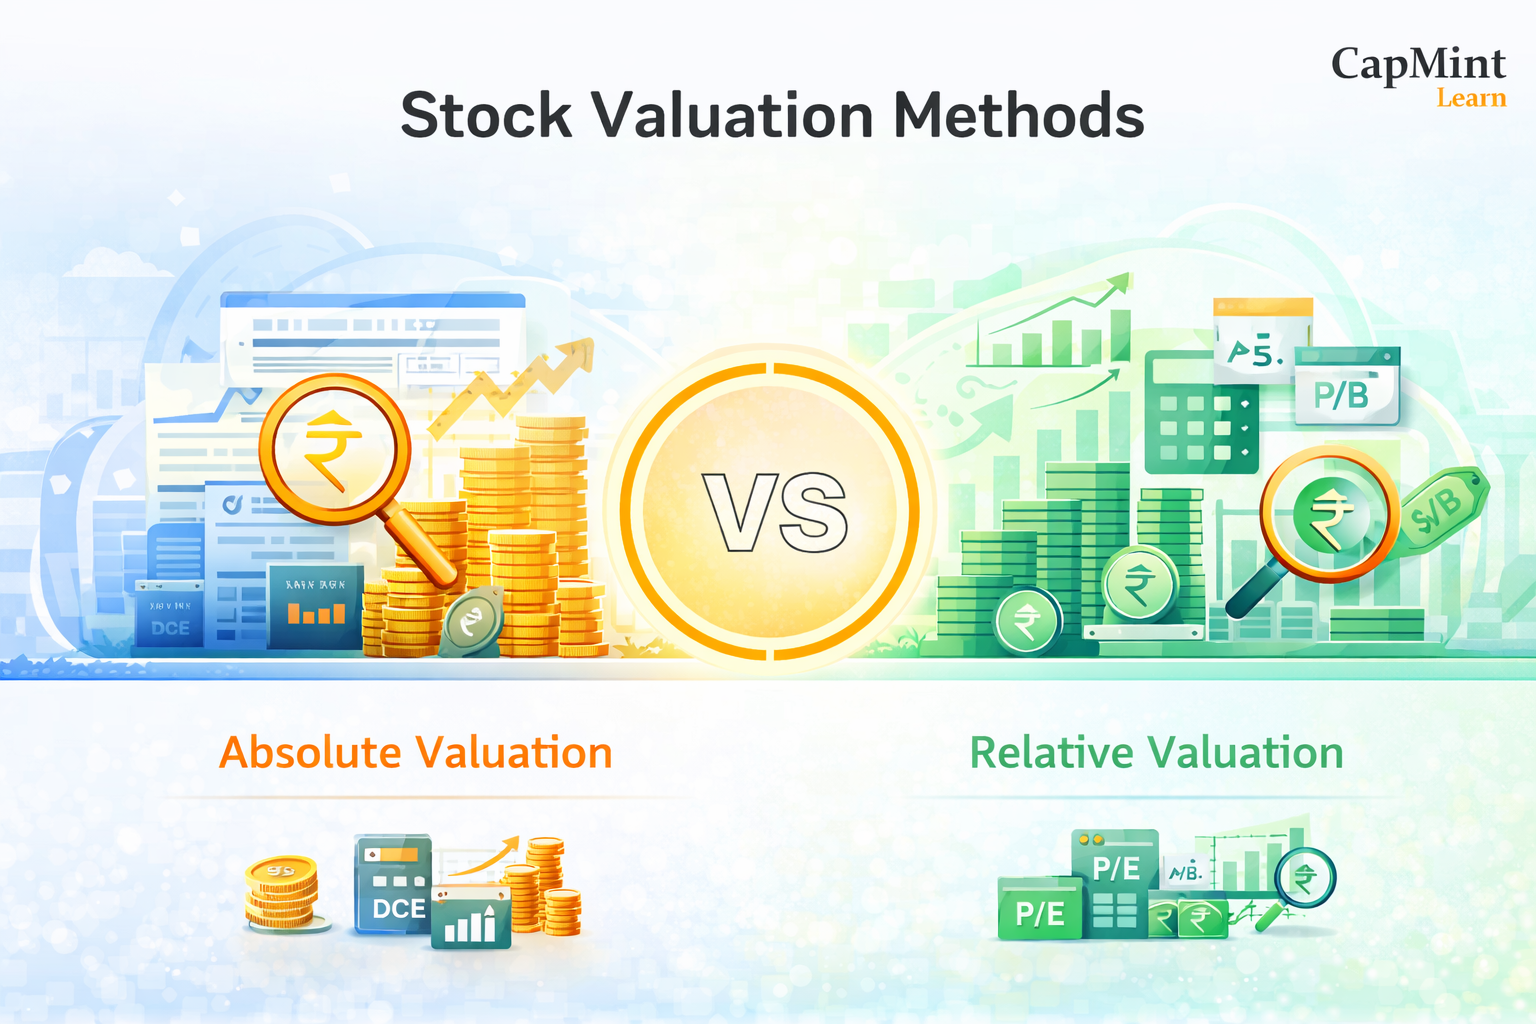
As a result, stock valuation methods are broadly classified into two categories:
Absolute valuation methods focus on estimating a company’s intrinsic value using its financial fundamentals.
Relative valuation methods compare a company’s valuation with that of similar companies in the market.
Using both approaches together provides a more balanced and realistic view of stock market valuation, rather than relying on a single number or model. In practice, when both approaches point to a similar valuation range, the confidence in that estimate increases meaningfully. When they diverge, it signals that either the assumptions in the absolute model need revisiting or the peer comparison is not capturing something specific about the company.
Absolute Valuation Methods
Absolute valuation focuses on estimating what a company is worth based on its own financial performance, independent of how other stocks are priced.
Dividend Discount Model (DDM)
The Dividend Discount Model is one of the earliest stock valuation methods. It values a stock based on the present value of all future dividends.
This method works best for companies that pay stable and predictable dividends. You estimate future dividends and discount them back to today using a required rate of return. The resulting value represents the intrinsic value of the stock.
However, DDM is not suitable for companies that do not pay dividends or have irregular payouts. As a result, it is mainly used for mature, stable businesses. In the Indian context, DDM finds limited but meaningful application with companies like Coal India, Power Grid Corporation, or large PSU banks that have a track record of consistent dividend payments. For high-growth companies in sectors like IT services or consumer discretionary, where dividend payout ratios are low and reinvestment is the priority, DDM produces values that significantly understate the company’s true worth because it ignores the value created through reinvested earnings.
The basic Gordon Growth Model formula, a simplified version of DDM, assumes dividends grow at a constant rate indefinitely:
Intrinsic Value = Expected Dividend per Share / (Required Rate of Return – Dividend Growth Rate)
For example, if a company pays a dividend of ₹10 per share, dividends are expected to grow at 5% annually, and your required return is 12%, the intrinsic value would be ₹10 / (0.12 – 0.05) = ₹142.86. The sensitivity to the growth rate assumption is high. Changing the growth rate from 5% to 6% in this example raises the intrinsic value to ₹166.67, a 17% difference from a single percentage point change. This sensitivity is one reason DDM should be used cautiously and cross-checked against other methods.
Discounted Cash Flow (DCF) Analysis
Discounted Cash Flow analysis is one of the most widely used methods of valuation of shares, especially for long-term investors. Instead of dividends, it focuses on the cash the business generates.
DCF estimates the future cash flows of a company and discounts them back to their present value. This reflects the principle that money received in the future is worth less than money received today.
The basic structure of a DCF model involves three components:
Projection period: Typically 5–10 years of detailed cash flow projections based on revenue growth, operating margins, capital expenditure, and working capital requirements.
Terminal value: Since a business is expected to continue beyond the projection period, a terminal value captures the value of all cash flows from that point onward. This is usually calculated either as a perpetuity growing at a modest rate (2–4% for Indian companies, reflecting long-term nominal GDP growth) or using an exit multiple on the final year’s EBITDA or free cash flow.
Discount rate: Future cash flows are discounted at the Weighted Average Cost of Capital (WACC) to arrive at their present value. For most Indian companies, WACC typically falls in the 10–14% range, depending on the company’s capital structure and risk profile.
DCF forces you to think deeply about revenue growth, profitability, capital expenditure, and long-term sustainability. While powerful, it is sensitive to assumptions, which is why realistic inputs are crucial. A common pitfall is projecting aggressive growth rates for the first five years while simultaneously using an optimistic terminal growth rate, which can inflate the valuation significantly. The terminal value alone often accounts for 60–70% of the total DCF value, making the terminal growth rate and exit multiple among the most influential assumptions in the entire model. Testing the valuation across a range of assumptions, rather than relying on a single output, produces a more honest assessment of what the company might be worth.
Asset-Based Valuation
While not as commonly discussed as DCF or DDM, asset-based valuation deserves mention because it applies to specific types of companies. This method values a company based on the net value of its assets minus its liabilities.
Asset-based valuation is most relevant for holding companies, real estate firms, investment companies, or businesses being evaluated for liquidation. In India, it finds practical application in valuing companies like Bajaj Holdings, Bombay Burmah, or other holding structures where the market cap often trades at a significant discount to the sum of the parts. It is less useful for asset-light businesses like IT services or platform companies, where the bulk of value comes from intangible assets like brand, intellectual property, and human capital that do not appear on the balance sheet at fair value.
Relative Valuation Methods
Relative valuation compares a company’s valuation with that of similar companies. Instead of asking what the stock is worth on its own, it asks whether the stock is cheap or expensive relative to peers.
Comparable Company Analysis
In this method, you compare valuation multiples of similar companies within the same industry. If a company trades at a much lower or higher multiple than its peers, it signals the need for deeper analysis.
This approach reflects how the market values similar businesses under current conditions and is widely used due to its simplicity and practicality. The key challenge lies in selecting truly comparable companies. Two companies in the same sector can have very different growth rates, margin profiles, return on equity figures, and capital structures, all of which justify different valuation multiples. Comparing a high-growth NBFC with a mature PSU bank purely on the basis of price-to-book, for instance, is misleading without adjusting for the differences in ROE and growth trajectory.
For Indian markets, sector-level benchmarks are a useful starting reference. IT services companies typically trade at 20–30x earnings, FMCG companies at 40–60x, PSU banks at 0.8–1.5x book value, and capital goods companies at 30–50x depending on the order book cycle. These ranges shift over time with market conditions, but they provide a baseline for assessing whether a specific stock within the sector is trading at a premium or discount to the group.
Valuation Multiples and Ratios
Commonly used stock valuation methods rely on ratios that provide quick comparative snapshots. The most widely used multiples include:
Price-to-Earnings (P/E): The most popular equity valuation multiple. It divides the share price by earnings per share. A P/E of 25x means the market is paying ₹25 for every ₹1 of current earnings. P/E is intuitive and easy to calculate, but it can be distorted by one-time gains or losses, accounting differences, and varying tax rates. Using trailing twelve-month (TTM) earnings gives a backward-looking view, while forward P/E based on estimated next-year earnings is more useful for growth-oriented analysis.
Price-to-Book (P/B): Compares the stock price to the book value per share. This is particularly relevant for banks and financial services companies, where the balance sheet is the core of the business. A bank trading below 1x book value may signal either undervaluation or concerns about asset quality, and distinguishing between the two requires examining metrics like net NPA ratios, provision coverage, and return on assets.
EV/EBITDA: Compares enterprise value to operating earnings before interest, taxes, depreciation, and amortisation. Because it uses EV rather than market cap, it neutralises differences in capital structure and is preferred for comparing companies with different debt levels. EV/EBITDA is especially useful in capital-intensive sectors like telecom, infrastructure, and manufacturing, where depreciation and debt significantly affect net earnings but not operating cash generation.
Price-to-Sales (P/S): Used for companies that are not yet profitable or have volatile earnings. This is relevant for early-stage listed companies, new-age tech businesses, or turnaround situations where earnings-based multiples are either negative or misleading.
These ratios allow quick comparisons but should always be interpreted in context. A low multiple does not automatically mean undervaluation, and a high multiple does not always indicate overvaluation. Growth, risk, and business quality matter. A company trading at 50x P/E with 30% earnings growth and high return on equity may actually be cheaper, in terms of the growth it delivers per unit of valuation, than a company at 15x P/E with flat earnings and declining margins.
Precedent Transaction Analysis
This method values a company by looking at the prices paid in recent acquisitions of similar businesses. It is particularly useful in M&A contexts but can also give public market investors a sense of what strategic or financial buyers consider a fair price for companies in a given sector.
In India, precedent transaction data is available through deal databases and financial news archives. For example, if a private equity firm acquired a mid-sized Indian pharma company at 18x EBITDA, and a publicly listed pharma company with similar characteristics trades at 12x EBITDA, it provides a data point for assessing potential undervaluation, though differences in control premium, synergies, and deal-specific factors must be considered.
Why Stock Valuation Matters for Investors
Many investors rely only on charts, news, or opinions circulating on social media. While these inputs can provide short-term signals, they do not explain whether a stock is fundamentally cheap or expensive. This is where stock valuation becomes essential.
Stock market valuation helps investors in the following ways:
Avoid Overpaying for Hype-Driven Stocks
Markets often push stock prices higher based on trends, news, or short-term excitement. Valuation helps you check whether the current price is supported by earnings, cash flows, and growth. This reduces the risk of buying stocks that are already priced far above their true business value. The Indian market has seen multiple instances of this, from infrastructure stocks in 2007–08 to certain new-age tech listings in 2021–22, where valuation discipline would have prevented significant capital erosion.
Identify Strong Businesses at Reasonable Prices
Valuation allows you to separate quality businesses from expensive ones. It helps identify companies with strong fundamentals that are still available at sensible prices, improving the chances of stable and long-term returns. The best opportunities often emerge during broad market corrections, when even high-quality businesses get sold off indiscriminately. Having a pre-existing sense of what a company is worth allows you to act with conviction when such opportunities appear, rather than waiting for the uncertainty to pass (by which point prices have usually recovered).
Understand Risk Through Price-Performance Connection
Risk increases when stock prices move faster than business performance. Valuation links price with earnings, growth, and cash generation, helping you understand how much expectation is already built into the stock. A company trading at 80x earnings, for instance, needs to deliver exceptional growth for several years just to justify its current price. If growth disappoints even slightly, the multiple compression can result in sharp declines even without any deterioration in the underlying business.
Build Conviction and Reduce Emotional Decisions
Knowing what a stock is worth provides clarity. Valuation gives you a reference point that helps you stay disciplined during volatility and avoid reacting emotionally to short-term market movements. During the March 2020 sell-off, investors who had a clear sense of their holdings’ intrinsic value were better positioned to hold or add to positions, while those without a valuation framework were more likely to sell at the bottom out of panic.
Using Multiple Methods for Better Stock Market Valuation
No single valuation method can capture the full picture of a company’s worth. Every valuation model relies on assumptions, and each method has its own strengths and limitations. This is why experienced investors rarely depend on just one approach. Instead, they use multiple stock valuation methods to arrive at a realistic valuation range rather than a single precise number.
For instance, an investor may start with a discounted cash flow analysis to estimate intrinsic value based on expected future cash flows. This estimate is then cross-checked using relative valuation metrics such as price-to-earnings or EV-to-EBITDA, compared with similar companies in the same industry. If the DCF value and market multiples suggest a similar valuation range, it increases confidence that the stock is fairly priced.
On the other hand, if the DCF suggests the stock is undervalued but valuation multiples show it trading at a premium to peers, it signals the need for deeper analysis. The premium could be justified by higher growth, stronger margins, or superior business quality, or it could indicate overly optimistic assumptions in the model.
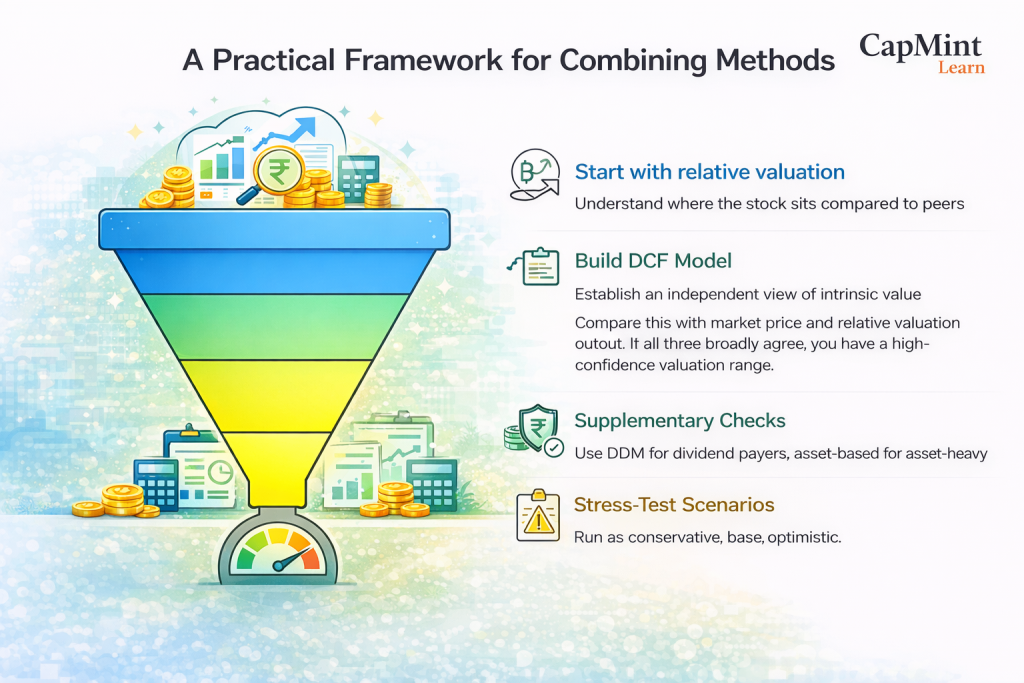
A practical framework for combining methods:
Start with relative valuation to understand where the stock sits compared to peers. This gives you a quick sense of whether the market sees the company as premium, average, or discount relative to its sector.
Then build a DCF model to form an independent view of intrinsic value. Compare this with the market price and the relative valuation output. If all three broadly agree, you have a high-confidence valuation range.
Use DDM as a supplementary check for dividend-paying companies, and asset-based valuation for holding companies or asset-heavy businesses.
Stress-test across scenarios. Run the DCF with conservative, base, and optimistic assumptions for revenue growth and margins. If the stock looks undervalued even under conservative assumptions, the margin of safety is meaningful. If it only looks cheap under the most optimistic scenario, the risk-reward may not be favourable.
By combining different methods, investors reduce the risk of relying on a single set of assumptions. This approach leads to more balanced stock market valuation and supports clearer, more informed investment decisions. The goal is not precision but rather a defensible range. A valuation range of ₹450–550 for a stock trading at ₹380 tells you something useful, even though the exact intrinsic value within that range is uncertain.
Conclusion
Stock valuation is not about arriving at a single perfect number. It is a structured way to assess whether a stock’s market price is justified by the underlying business fundamentals such as earnings, cash flows, growth, and risk.
Different stock valuation methods exist because companies differ in structure and maturity. Absolute methods estimate intrinsic value, while relative methods show how a stock is priced compared to peers. Used together, they offer a more balanced view of stock market valuation.
For investors, valuation brings discipline. It helps avoid overpaying, improves risk assessment, and builds conviction during market volatility, leading to more informed long-term investment decisions. The skill develops over time. The more companies you value, the better your intuition becomes for recognising when assumptions are realistic and when a market price has stretched beyond what fundamentals can support.
Frequently Asked Questions (FAQs)
What is stock valuation in simple terms?
Stock valuation is the process of estimating what a company’s shares are worth based on its financial performance, growth prospects, and risk. It helps investors judge whether a stock is fairly priced, overvalued, or undervalued in the market. Think of it as the difference between the price tag and the actual worth of what you’re buying.
Which is the best stock valuation method for investors?
There is no single best method. Long-term investors often use discounted cash flow analysis along with relative valuation multiples. Using multiple methods together provides a more reliable valuation range than relying on just one model. The choice of primary method also depends on the type of company: DCF works well for companies with predictable cash flows, relative multiples are practical for quick sector comparisons, and DDM suits stable dividend payers.
Can stock valuation guarantee profits?
No. Valuation does not guarantee profits or predict short-term price movements. A stock can remain overvalued or undervalued for extended periods before the market corrects. What valuation does is improve decision-making by reducing the risk of overpaying and by aligning investments with business fundamentals, which over longer holding periods tends to produce better outcomes than buying based on momentum or sentiment alone.
Is stock valuation useful for short-term traders?
Stock valuation is mainly used by long-term investors, but even short-term traders benefit from knowing whether a stock is fundamentally stretched or reasonably priced. It adds context to price movements and market sentiment. A stock breaking out to new highs with strong fundamental support behind the move is a different proposition from one reaching new highs purely on speculative momentum with no corresponding improvement in earnings or cash flow.
What are common mistakes investors make in stock valuation?
Several recurring errors affect valuation accuracy. Using overly optimistic growth assumptions in DCF models is among the most common, often producing intrinsic values that are two or three times the current price, which should serve as a red flag rather than a signal to buy aggressively. Other frequent mistakes include comparing P/E ratios across companies with very different growth profiles, ignoring the impact of debt when using equity multiples, relying on a single year’s earnings rather than normalised or average earnings, and treating book value as a reliable proxy for intrinsic value in asset-light businesses where most value comes from intangibles.
Disclaimer: This content is for educational purposes only and does not constitute financial or investment advice. Investments in securities or other financial instruments are subject to market risk, including partial or total loss of capital. Past performance is not indicative of future results. Always consider your financial situation carefully and consult a licensed financial advisor before making investment or trading decisions.
Engineered for the obsessed. Built for traders.

Purpose-built terminals.
Zero compromise.
Built for speed.
Plot No 1290, 2nd Floor, 17th Cross, 5th Main, Sector-7, HSR Layout, Bangalore 560102
Follow us on
Mintcap Brokers Private Limited
CIN – U66110KA2023PTC178706 | Registered Address: Plot No 1290, Second Floor, 17th Cross, 5th Main, Sector-7, HSR Layout, Bangalore 560102 | Tel: 080 – 49552310 | Email ID: compliance@capmint.com | SEBI registered Stock Broker: INZ000322732 | NSE Cash/F&O Member ID: 90430 | BSE Cash/F&O Member ID: 6903 | MCX Member ID: 57400 | NCDEX Member ID: 1312 | SEBI registered Depository Participant: IN-DP-806-2025 | CDSL DP ID: 12102300 | NSE Clearing Member code: M70108 | AMFI-Registered Mutual Fund Distributor: ARN-289109 (Valid upto 28-Feb-2027) | Category II Execution Only Platform : E6903
Details of Client Bank Account
Compliance Officer: Ms. Shridevi Vungarala | Email ID: compliance@capmint.com | Tel no. + 91 9035330126 | Grievance Redressal Officer (GRO) – Ms. Shikha Gupta | Email ID: Grievance@capmint.com | Tel no: 9035331595.
Procedure to file a complaint on SEBI SCORES: Register on SCORES portal. Mandatory details for filing complaints on SCORES: Name, PAN, Address, Mobile Number, E-mail ID. Benefits: Effective Communication, Speedy redressal of the grievances. You may refer the website https://scores.sebi.gov.in/ for more information. You may also download the SEBI Scores app to log a complaint Android: https://play.google.com > store > apps > sebiscores iOS: https://apps.apple.com > app > sebiscores
Disclaimer
Investment in the securities market are subject to market risks, read all the related documents carefully before investing. Brokerage will not exceed the SEBI prescribed limit.
Mutual fund investments are subject to market risks, read all scheme related documents carefully before investing. Mutual Funds are not exchange-traded products.
Attention Investor:
- Stock Brokers can accept securities as margin from clients only by way of pledge in the depository system w.e.f. September 1, 2020.
- Update your mobile number & email Id with your stock broker/depository participant and receive OTP directly from depository on your email id and/or mobile number to create pledge.
- Pay 20% as upfront margin of the transaction value to trade in cash market segment.
- Investors may please refer to the Exchange’s Frequently Asked Questions (FAQs) issued vide circular reference NSE/INSP/45191 dated July 31, 2020 and NSE/INSP/45534 dated August 31, 2020 and other guidelines issued from time to time in this regard.
- Check your Securities /MF/ Bonds in the consolidated account statement issued by NSDL/CDSL every month.